Wk19 - Sell in May and Go Away?
Markets remain priced for a benign outcome, but the macro backdrop is shifting. This week, I review the age old seasonality adage, lay out my bear case for risk assets and look at some high conviction RV themes.

SELL IN MAY AND GO AWAY
but remember to come back in September
One of the market’s oldest seasonal adages which now has a modern twist that adds "but remember to come back in September". Its roots trace back to Britain’s financial district, where traders would traditionally reduce activity before the summer social season and return after Saint Leger Day - a major horse race which typically occurs mid-September (precisely the 2nd Saturday of September).
The modern version is also known as the Halloween Indicator - based on the idea that equity returns have historically been stronger from November to April than from May to October. Academic studies have also found that this seasonal pattern appeared across many global equity markets, with winter-period returns materially outperforming summer-period returns.
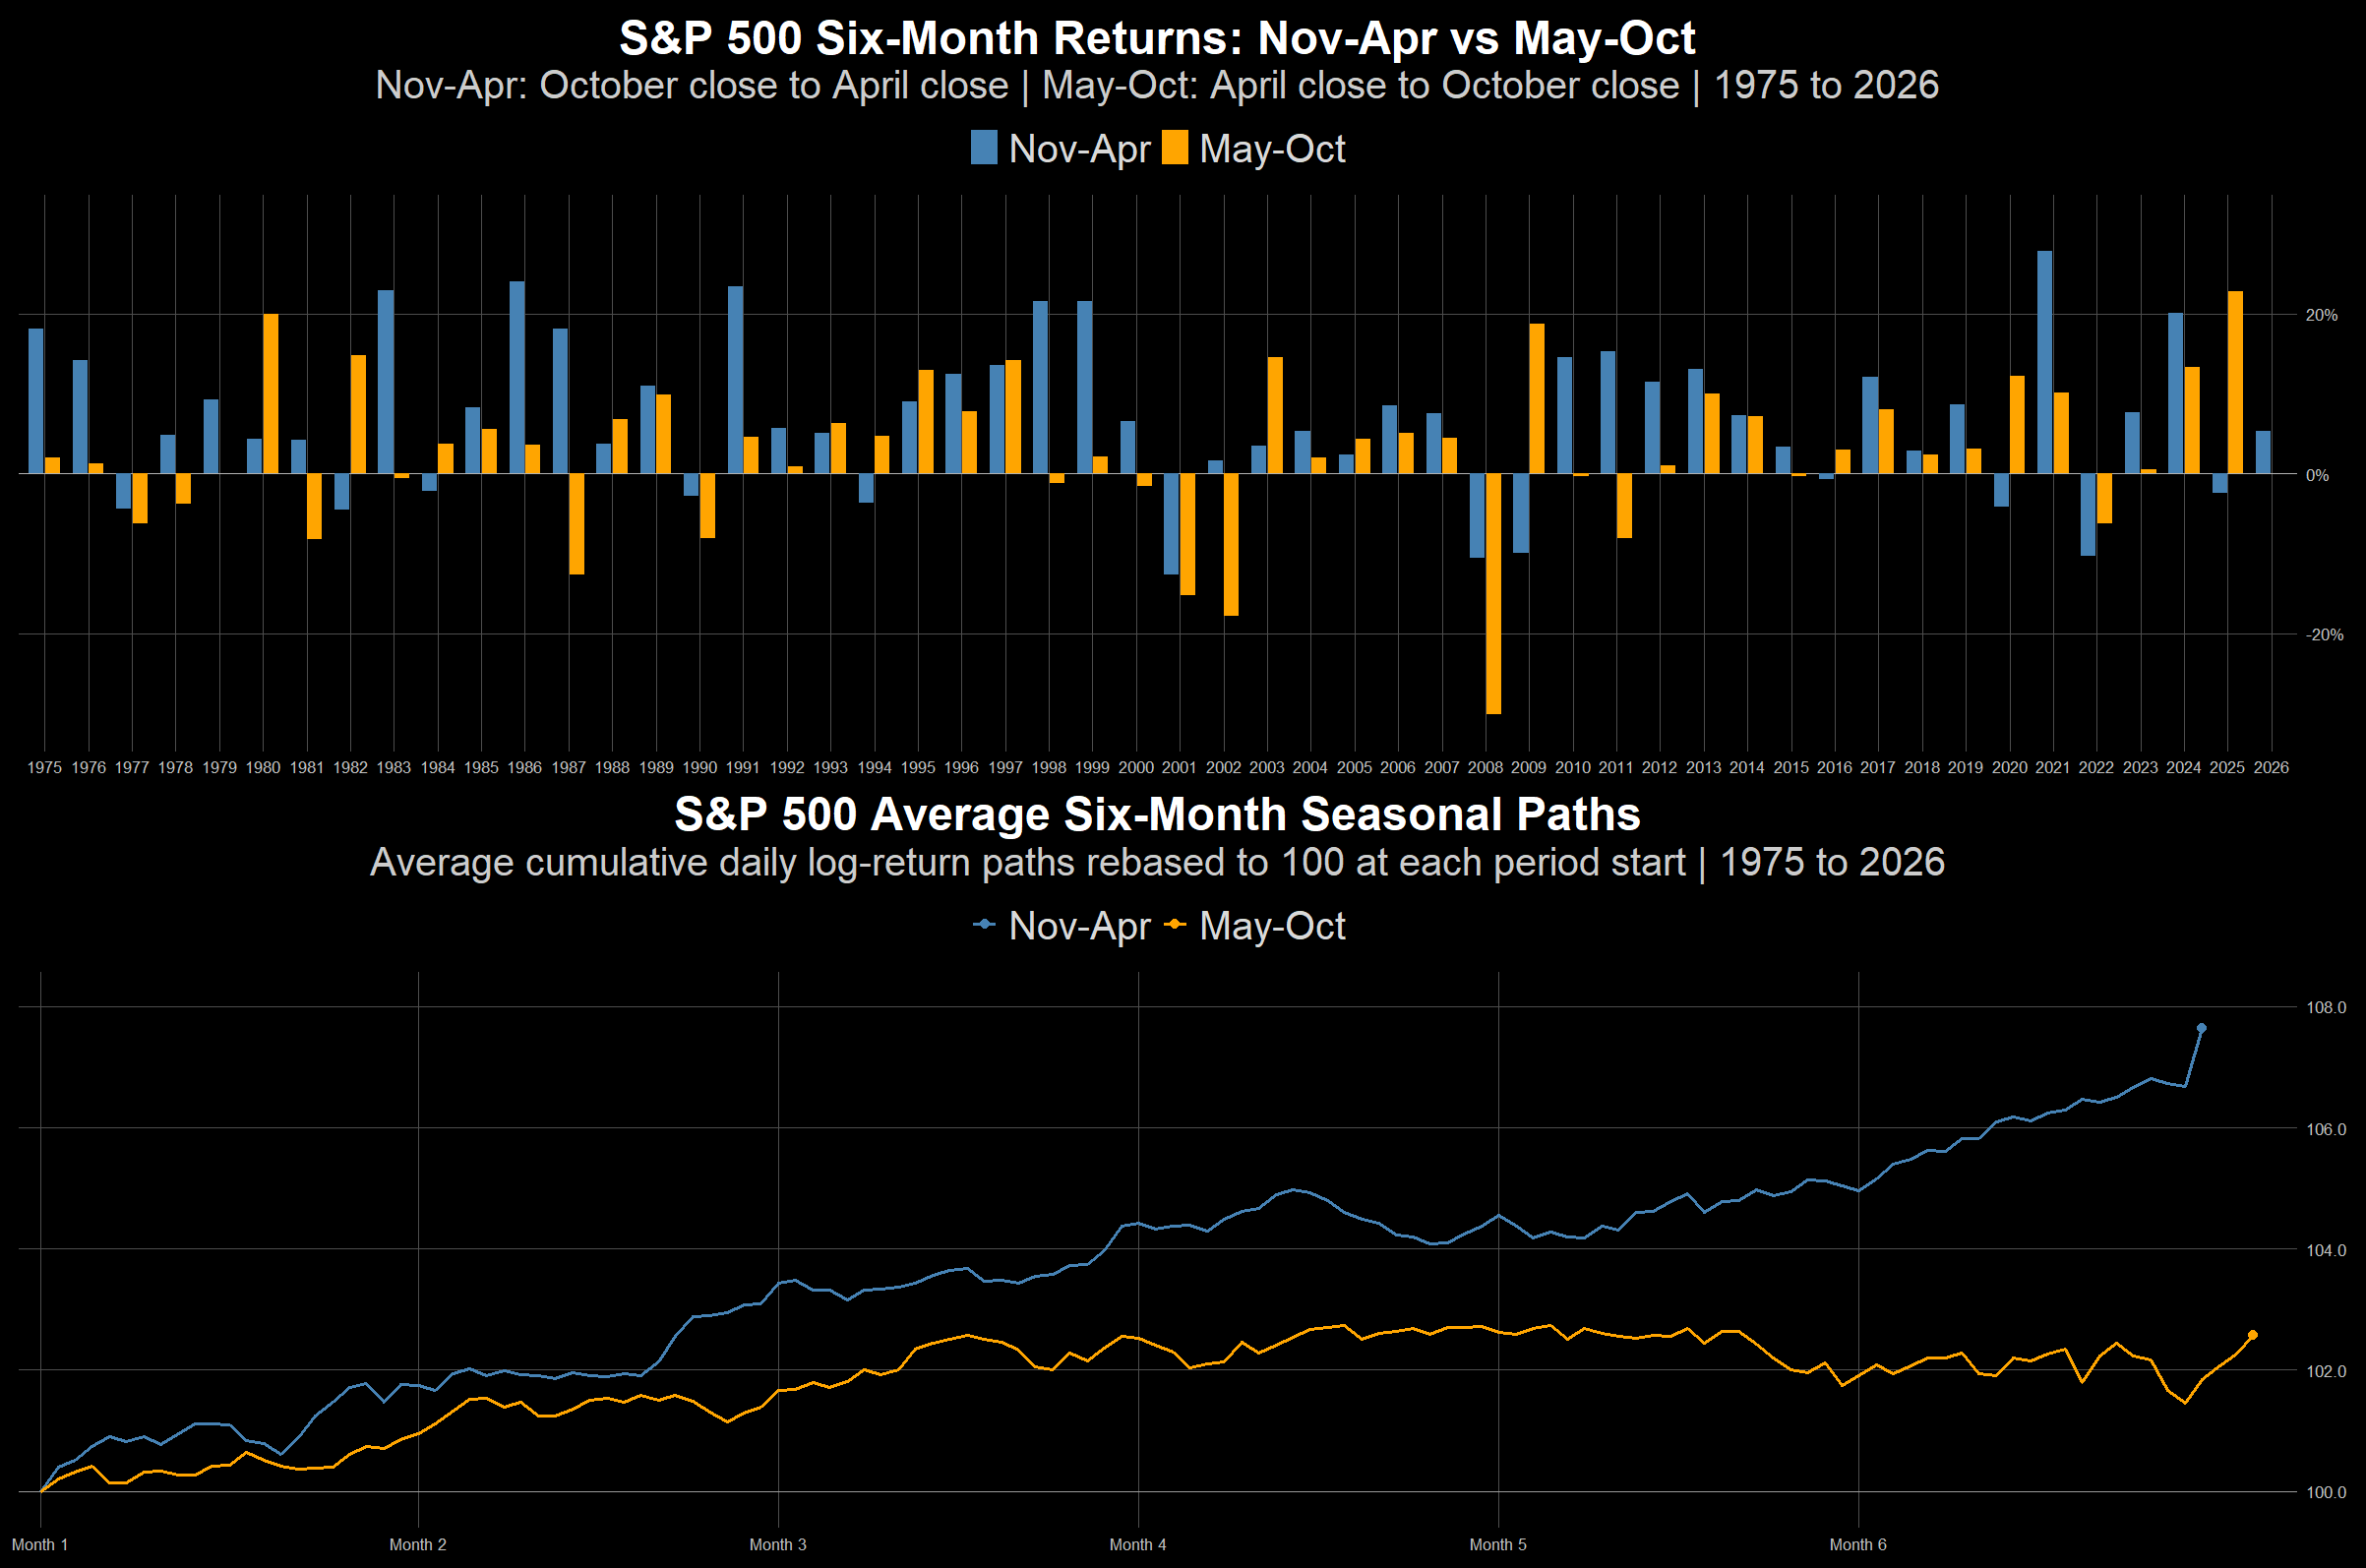
Often cited explanations for that performance dichotomy are that the Nov-Apr period coincides with numerous recurring flows and spending catalysts (e.g. Black Friday and Cyber Monday, back-to-school effects, year-end bonuses, employer retirement-plan contributions, tax refunds) to support consumer spending, corporate revenues, and equity market inflows.
From a trading perspective, whether for your stock portfolio or swing trading your tactical book, we take a more granular look at seasonalities over the coming months. From the table below, it's clear that May has historically been the strongest month of this six-month stretch and turns much weaker through the summer months.
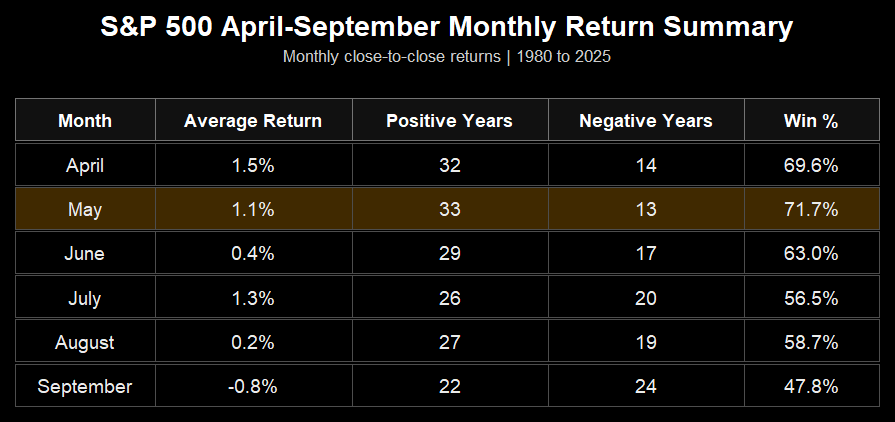
June has historically been quite decent, and the below seasonal path would suggest the end-of-May to early-June would historically be the most tactically opportune time to harvest gains, or initiate the first phase of any portfolio rebalancing intentions to create the optionality to later redeploy (perhaps around September) into new stocks they want to own, or increase exposure to existing ones.
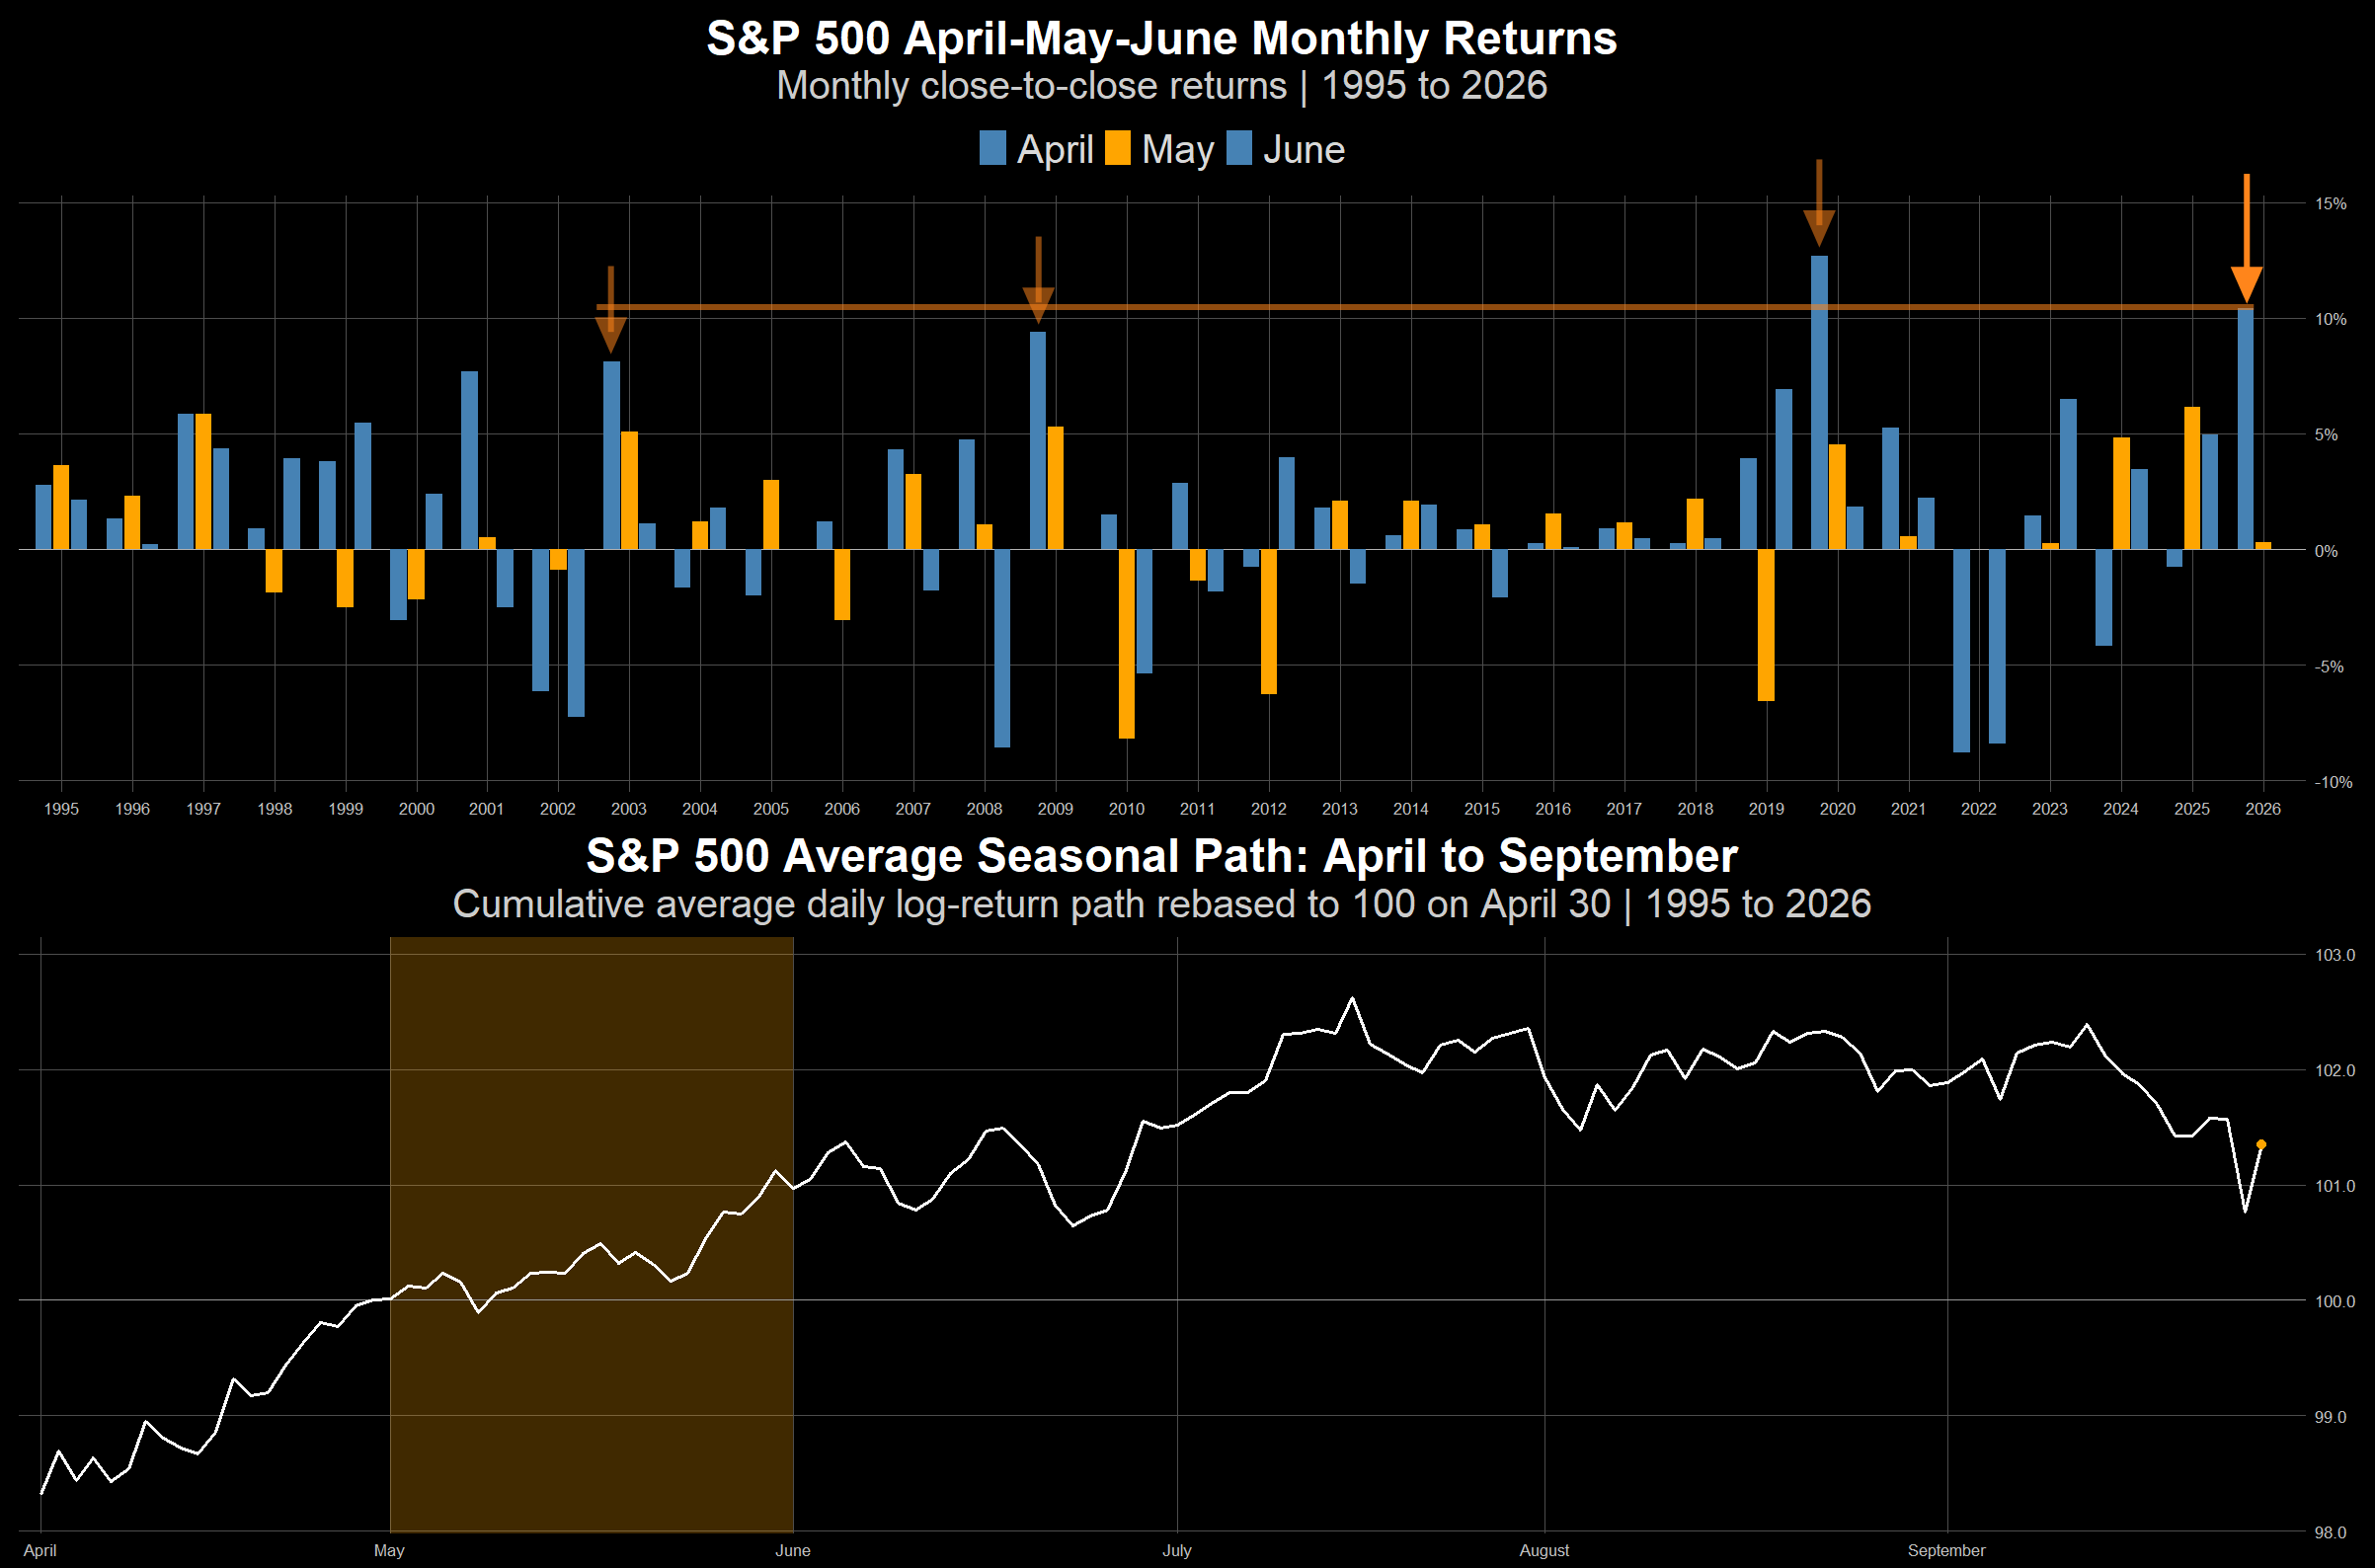
We can also see that when April months have been particularly strong, so has the May months. But what stands out this year was last month's gain being historically on par with 2020, 2009, and 2008 of which, rather interestingly, were all periods of significant monetary policy easing. Something that is arguably the complete opposite to the current environment, and therefore, arguably, less likely to repeat that same pattern as things currently stand. In the absence of a deal struck between the US and Iran, the typical Apr-Sep seasonality may serve to be a decent overview for the coming quarters.
Macro
Taking a slightly different approach to the usual macro recap, I'll weave in the latest macroeconomic developments into my outlined bear case for risk assets.
THE BEAR CASE
Markets are priced for a benign combination of strong earnings growth, resilient margins, continued AI capex, contained inflation, eventual Fed support, and no major demand destruction. It would assume that an energy shock would be relatively short-lived, but that assumption becomes particularly challenging from this month onwards should energy prices continue to stay elevated, the impacts of which will prove increasingly difficult to ignore.
1. No SoH Resolution In Sight
The SoH remains heavily restricted - US has intensified its naval blockade to constrain Iranian oil exports, while Iran continues to assert practical control over vessel movements with little willingness to relinquish that leverage. Khamenei issued a message on state tv on the occasion of National Persian Gulf Day outlining a “new chapter” in which Iran will impose “new legal rules and new management” over the SoH, while making it clear that Iran's nuclear, missile, and strategic capabilities are non-negotiable national assets.
Meanwhile, Iran had submitted a counter-proposal last week in which Trump said that he was "not satisfied", which was followed by comments from a senior officer of Iran's military command saying, "evidence has shown that the United States is not committed to any promises or agreements" and that renewed fighting was “likely”. In effect, these developments act to further constrain the already narrow path towards a compromise particularly with Iran seeing SoH control, sanctions relief and strategic deterrence (nuclear and missile capabilities) as linked issues, not so much as separate bargaining chips.
2. Energy Shock Pinch Point
This chart from the IEA is a good depiction of that potential macro pinch point. The left "base case" assumes shipments resuming from this month onwards, allowing the oil market to shift back into surplus for the 2nd half of 2026; the right "protracted case" of sustained disruptions would leave a more persistent deficit that force prices higher, weaken economic activity, and in turn lead to a large demand contraction that could be accompanied by deliberate demand-rationing policy measures of which we have been hearing about from some corners of the global economy.
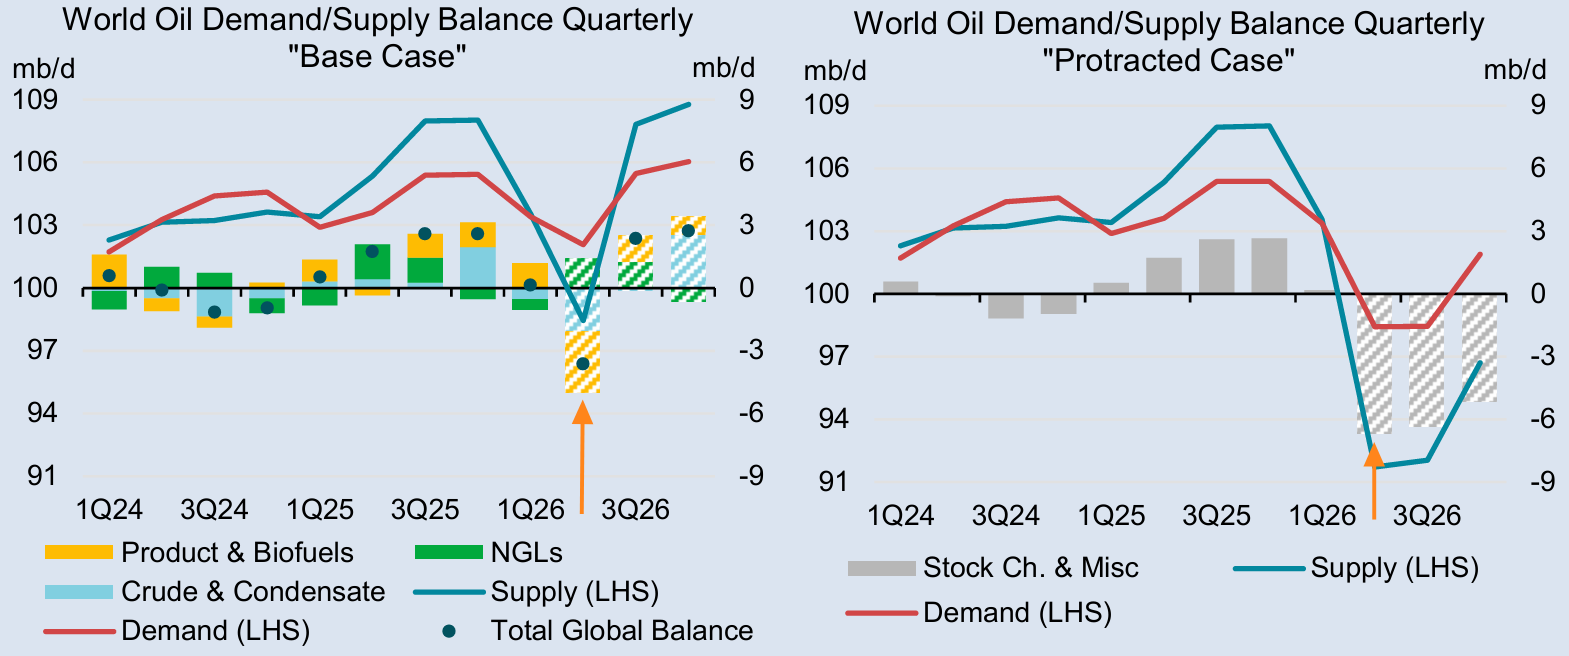
With the deadlock looking likely to persist, energy prices are likely to remain under upward pressure as the global market burns through the remaining buffers that have so far contained the shock, and the shock would become a more visible drag on the global economy.
3. Stagflation Risks Weaken Fed Put
An energy shock means the Fed cannot exercise its 'labour market put' as surging inflation weakens the usual “bad news is good news” reaction function. Meanwhile, Brent crude surged to its highest level since June of 2022 and higher fuel prices and transport/freight costs are already feeding through to economies.

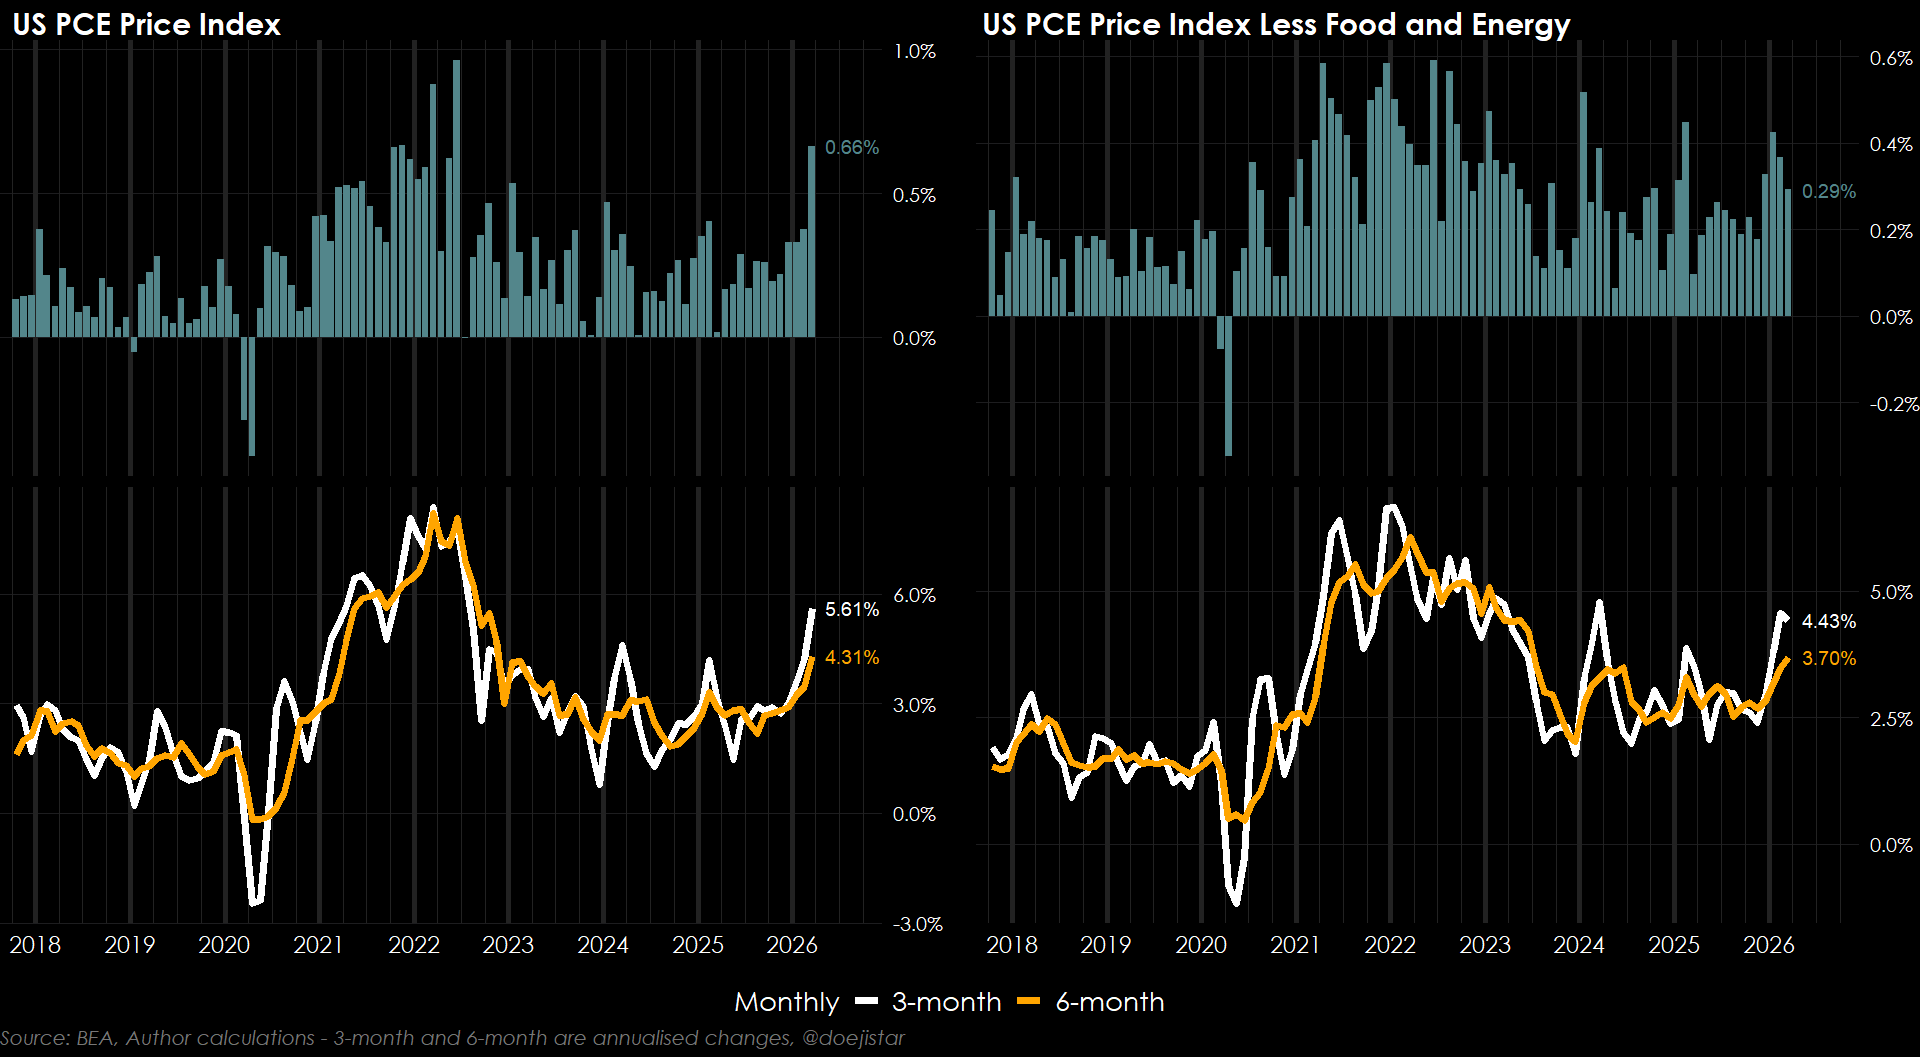
Last week's PCE data shows the biggest monthly headline jump since June of 2022 with all the 3 and 6-month rates now running above the effective fed funds rate. Core inflation has been relatively more tame, but as utilities, airfare, food, delivery and transport costs all become more expensive, the risk of headline inflation seeping into core components is a major risk for the coming months.
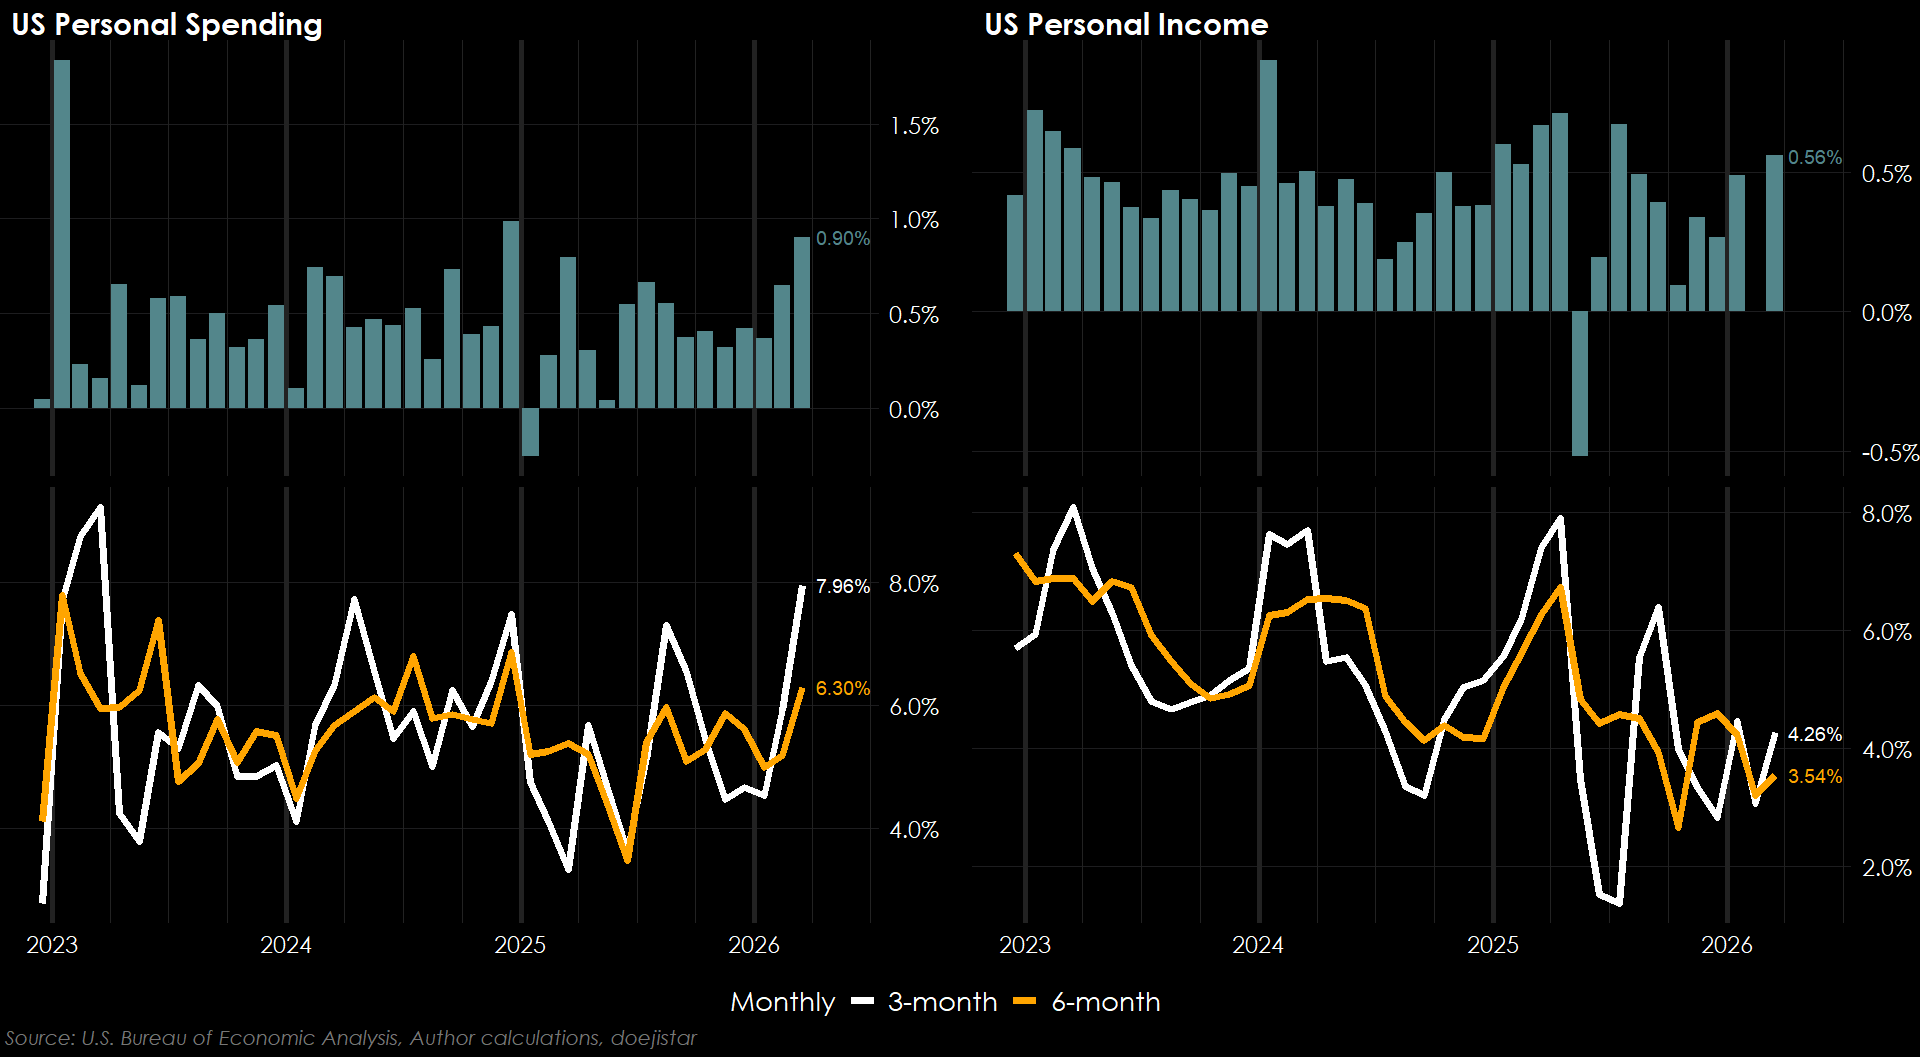
Personal Spending and Income trends have already been pointing to an increasing strain on households as spending has outpaced income increases.
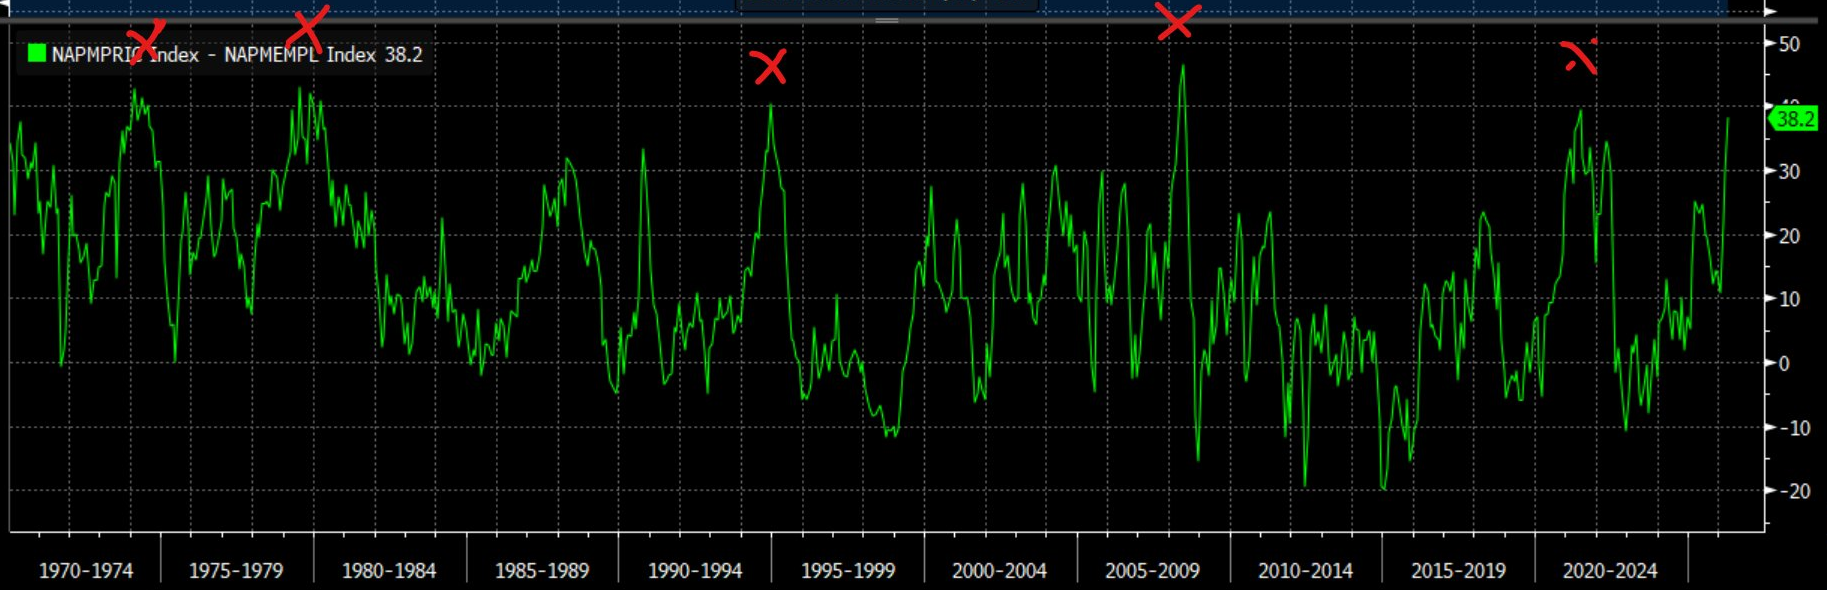
Manufacturing sector is also displaying stagflationary pressures with Prices paid soaring to the highest level since April of 2022, while Employment has fallen deeper into contraction again.
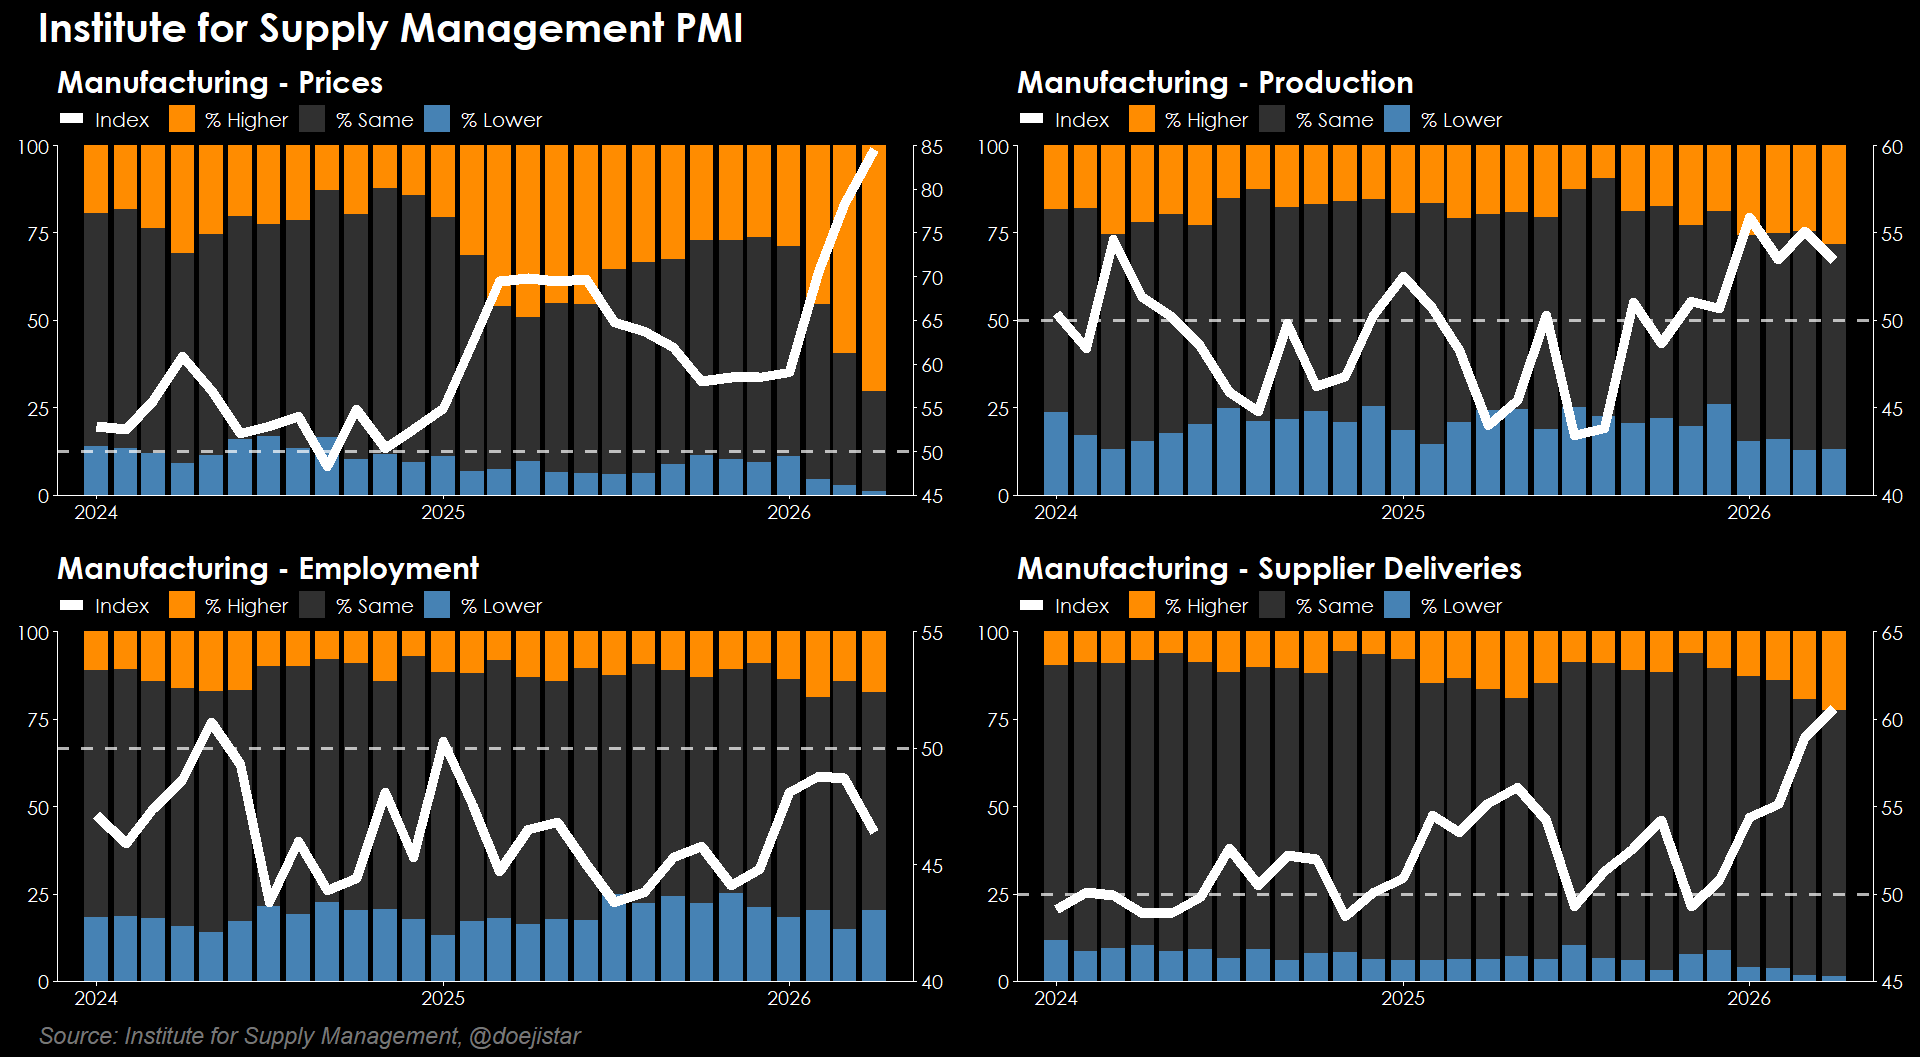
Viraj Patel offered some interesting perspective on those two components - the spread between prices paid & employment have only been higher on 5 occasions since the 1970s, 3 of which were recessions.
Risk assets have so far looked through an increasingly stagflationary backdrop that would normally pressure earnings multiples. But the feedback loop is becoming harder to ignore: weaker real spending colliding with rising input and transport costs, compressing margins, slowing hiring and investment — and being a feedback loop makes it a dynamic that can accelerate quickly once it takes hold.
4. US Earnings Expectations Are Vulnerable
One of the major reasons for the strong S&P500 performance is a 'meltup' in earnings expectations. This chart from Warren Pies shows how much have earnings expectations risen versus how much lower they were previously, which is a good way to put the positive change in earnings expectations into perspective since a large positive change can often be preceded by a large negative change. But we are clearly not seeing that at all since the Covid shock.
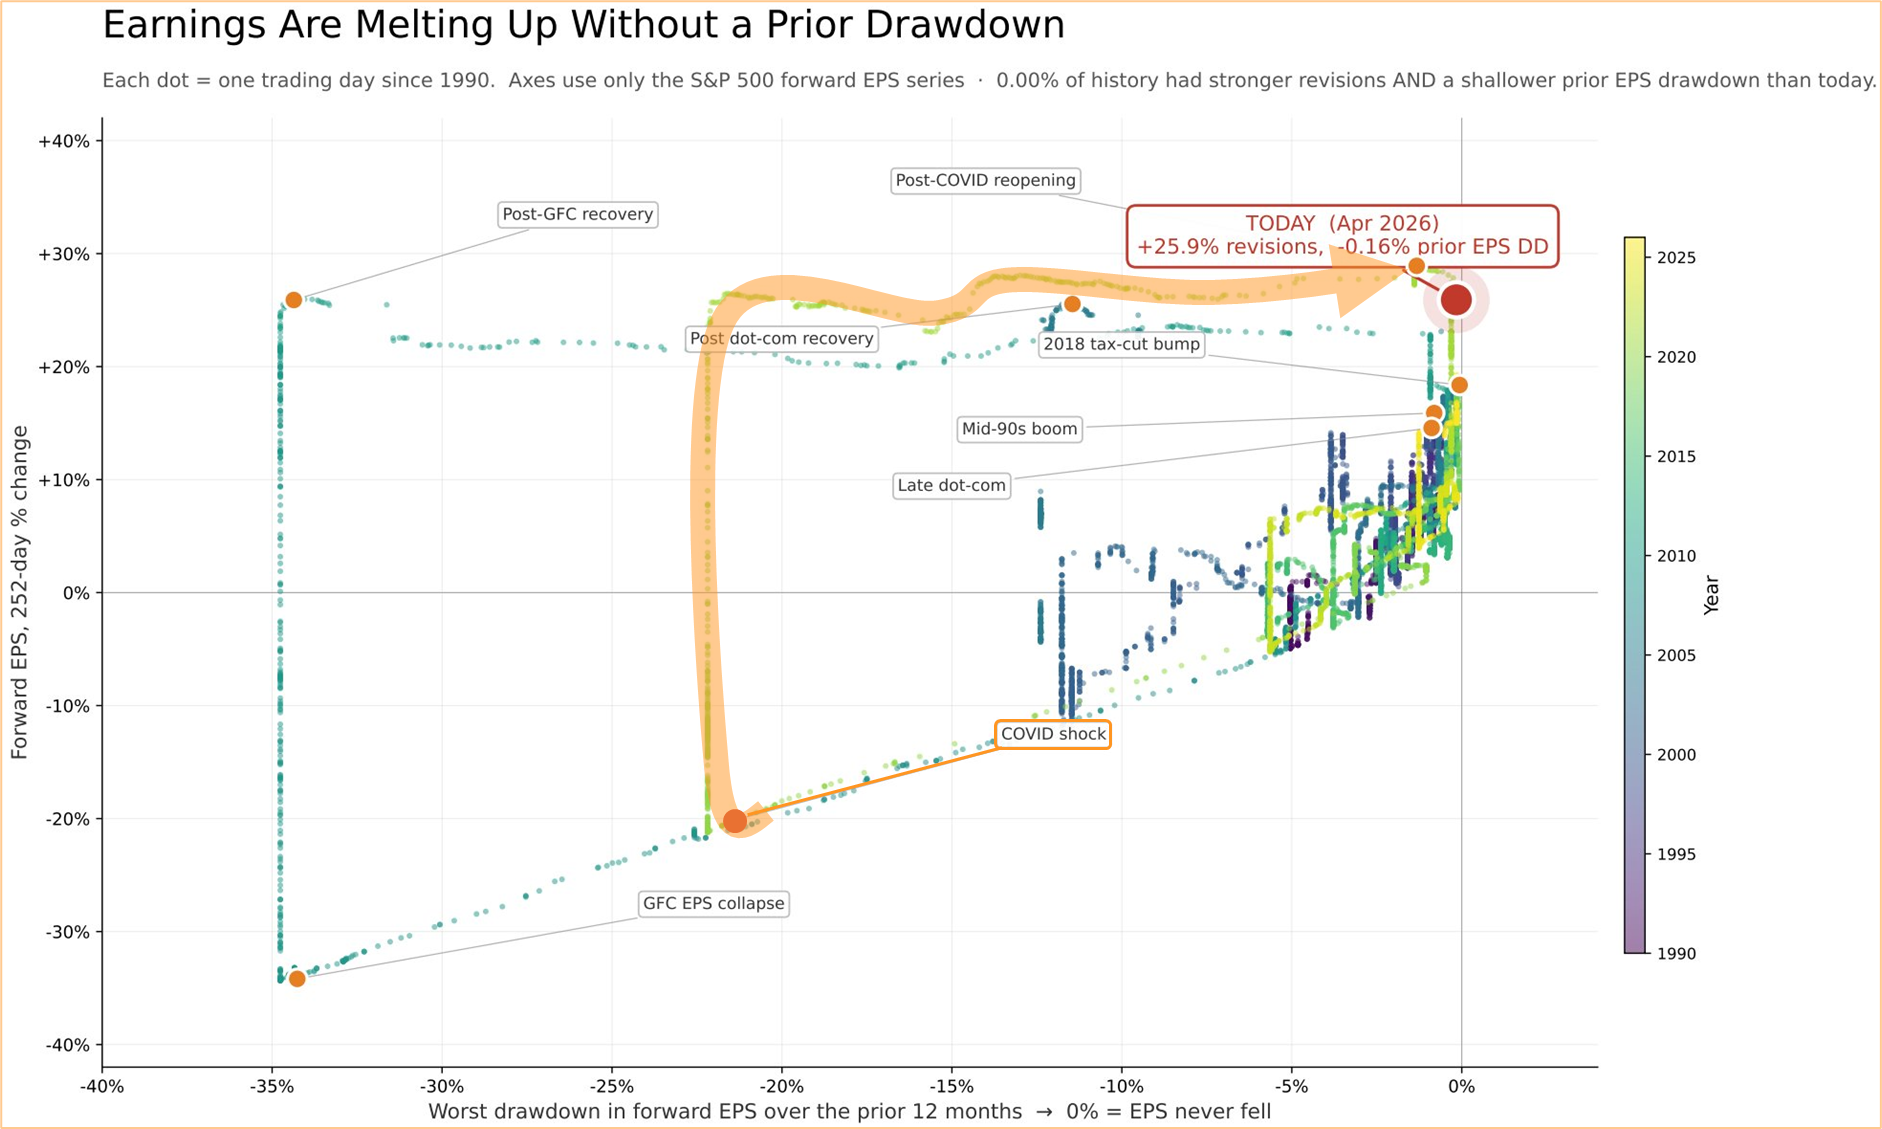
As strong as those expectations have been for stock market returns, that leaves little room for disappointment. If higher input costs and weaker demand begin to show up in the data where forward guidance is thrown into doubt, earnings expectations and revisions could turn lower.
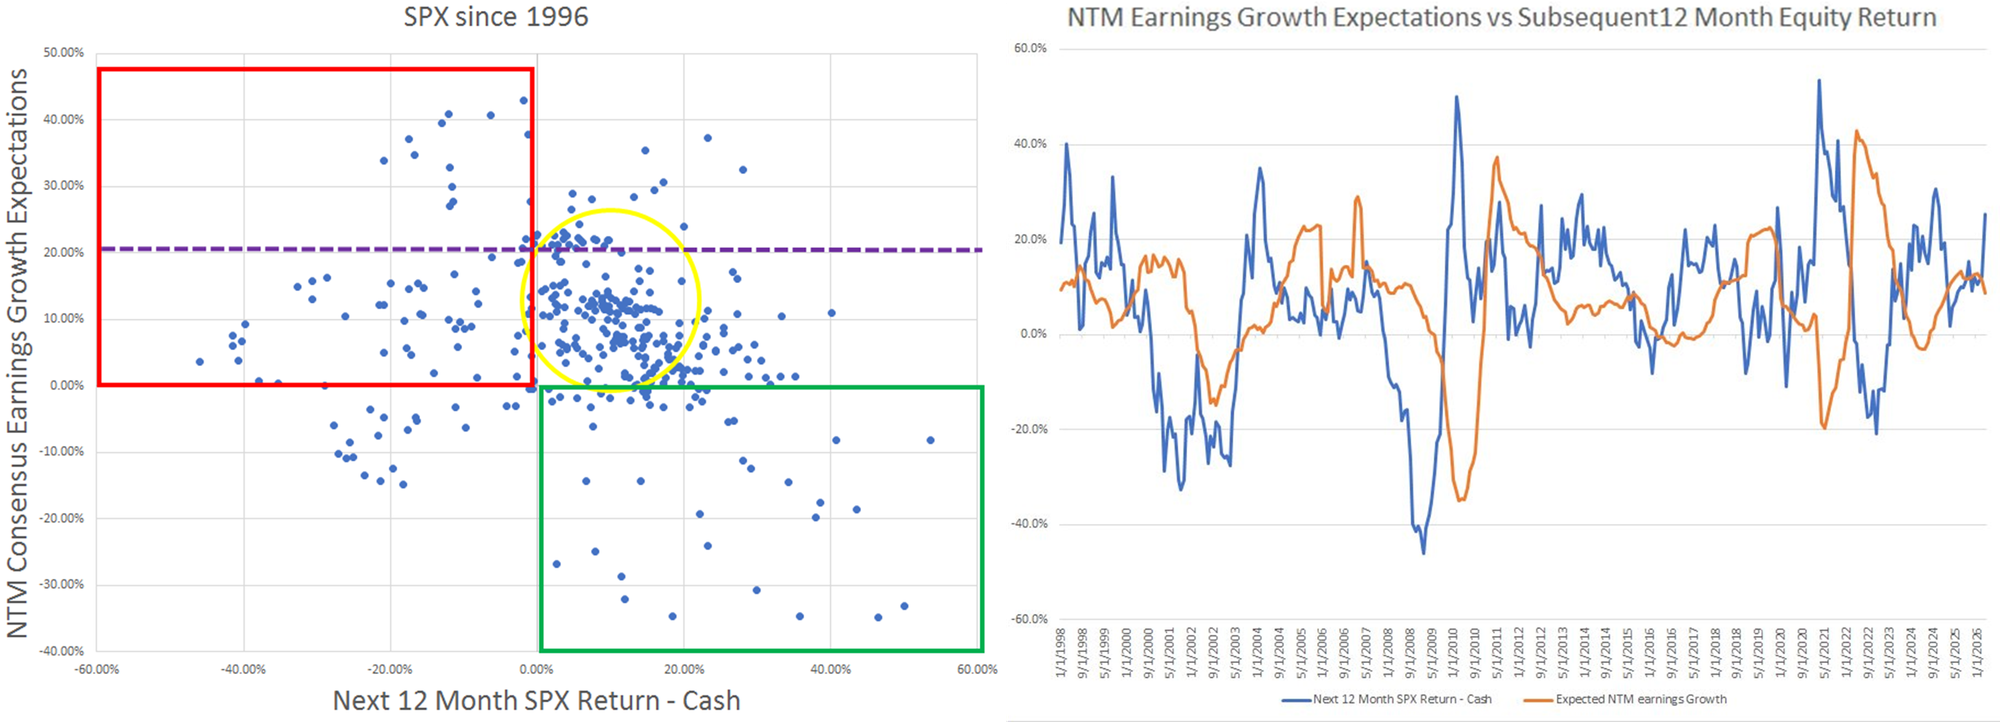
To further illustrate the 'room for little disappointment' point, Andy Constan looked at 12-month forward earnings expectations versus the subsequent 12-month return in the SPX. This puts into perspective that when earnings expectations are very high, SPX returns were in many instances not able to equal those expectations in the subsequent 12-months (red box).
5. AI Capex Is Not Immune
"Demand is off the charts" as Jensen Huang would repeatedly say, and that narrative continued to reverberate through the current earnings season with compute demand outpacing supply and pricing increases. Wall Street now estimates AI-capex could top $1 trillion in 2027 as hyperscalers announced even bigger spending plans.
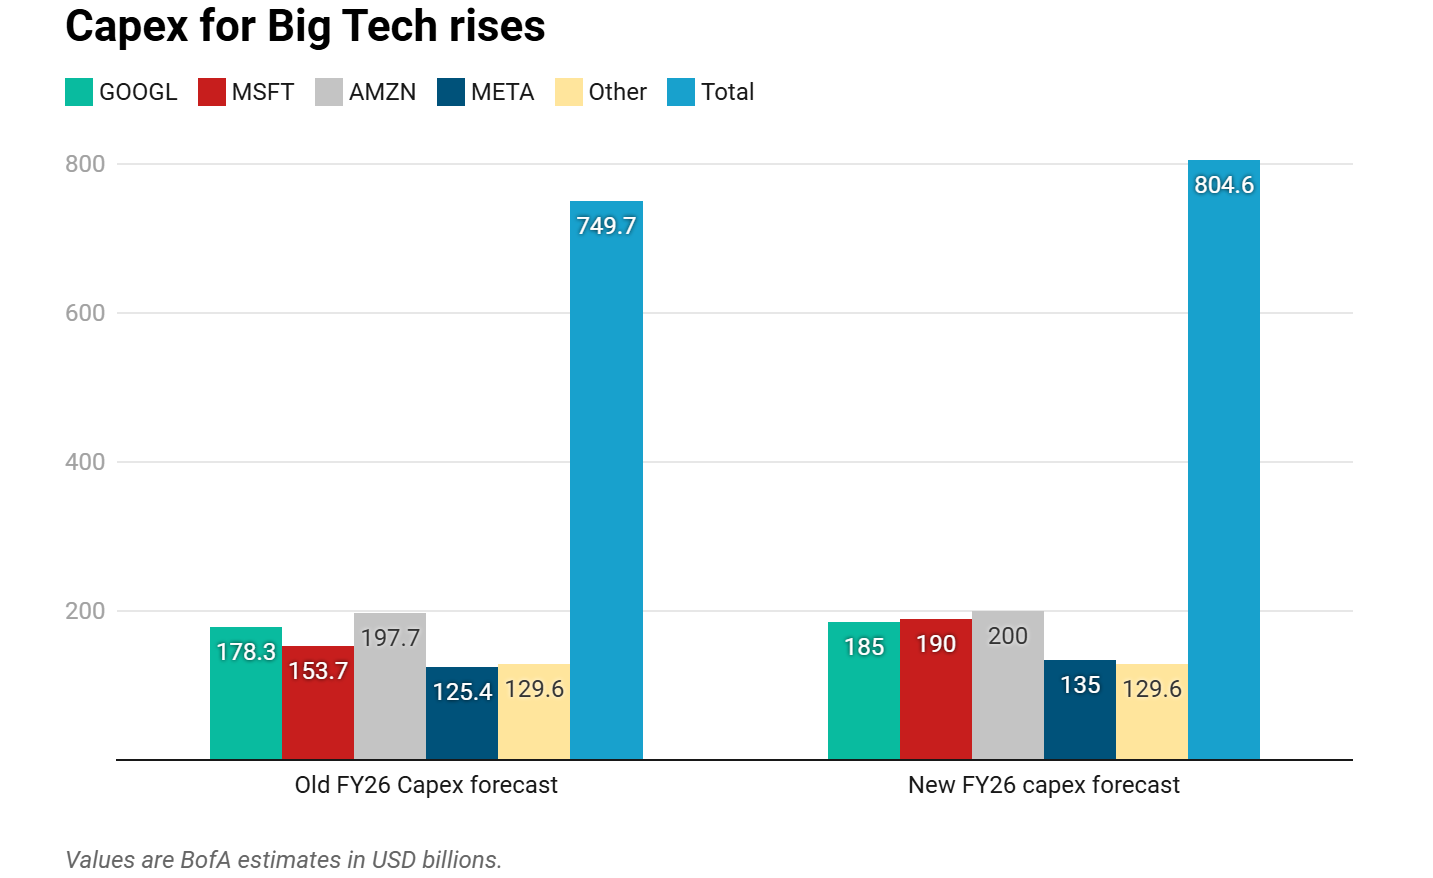
But with the AI infrastructure boom being extremely energy-, materials-, construction- and labour-intensive, rising costs of data centres, grid upgrades, cooling systems etc. presents ROI challenges particularly if energy prices continue to stay elevated causing demand growth to decelerate, and input and financing costs at every level become much greater than anticipated. That creates risk for not just the major tech names, but also the industrial and infrastructure beneficiaries that have been priced for continued capex strength.
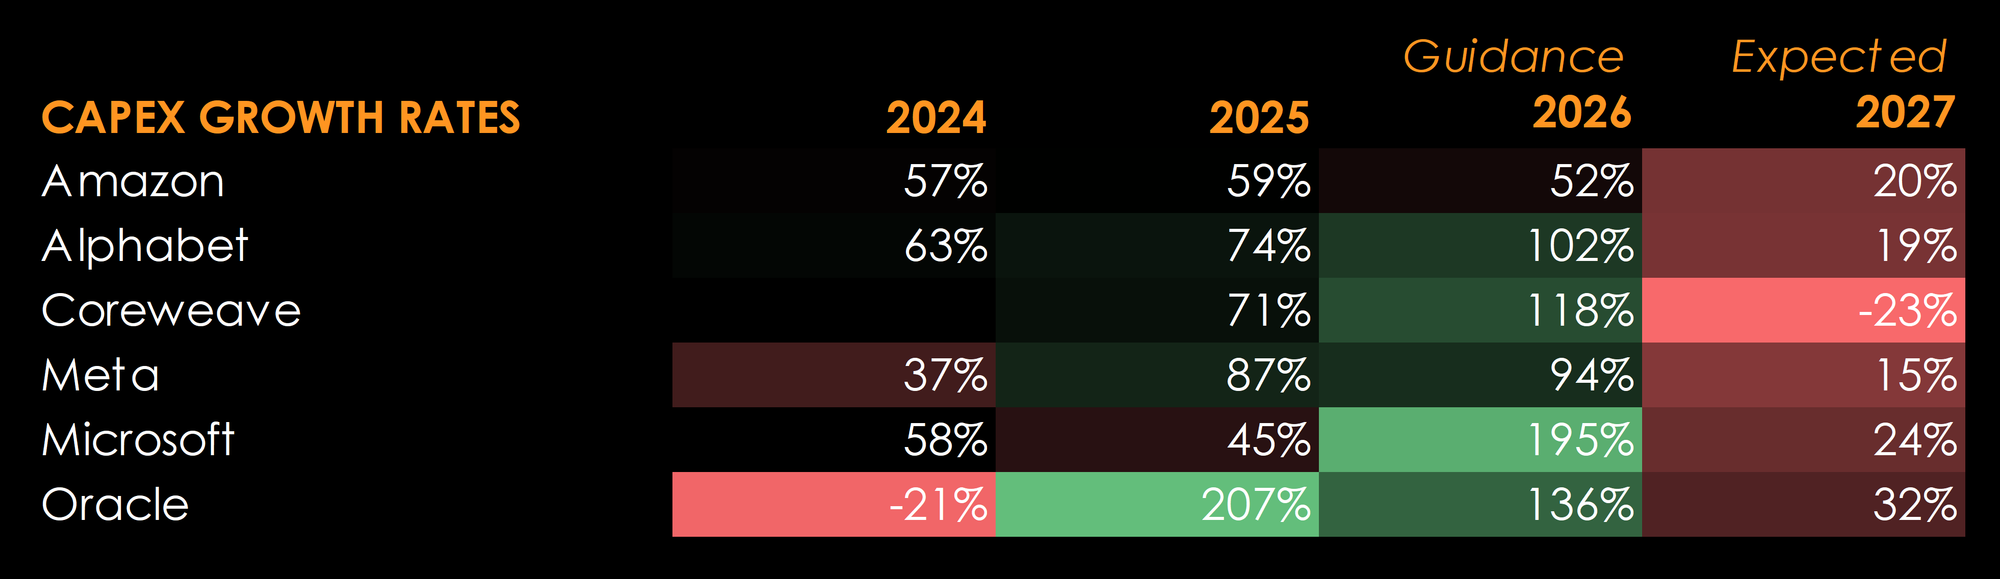
In addition, the AI-capex growth cycle is expected to peak this year from roughly 20% growth in 2027 from 100%+ this fiscal year.
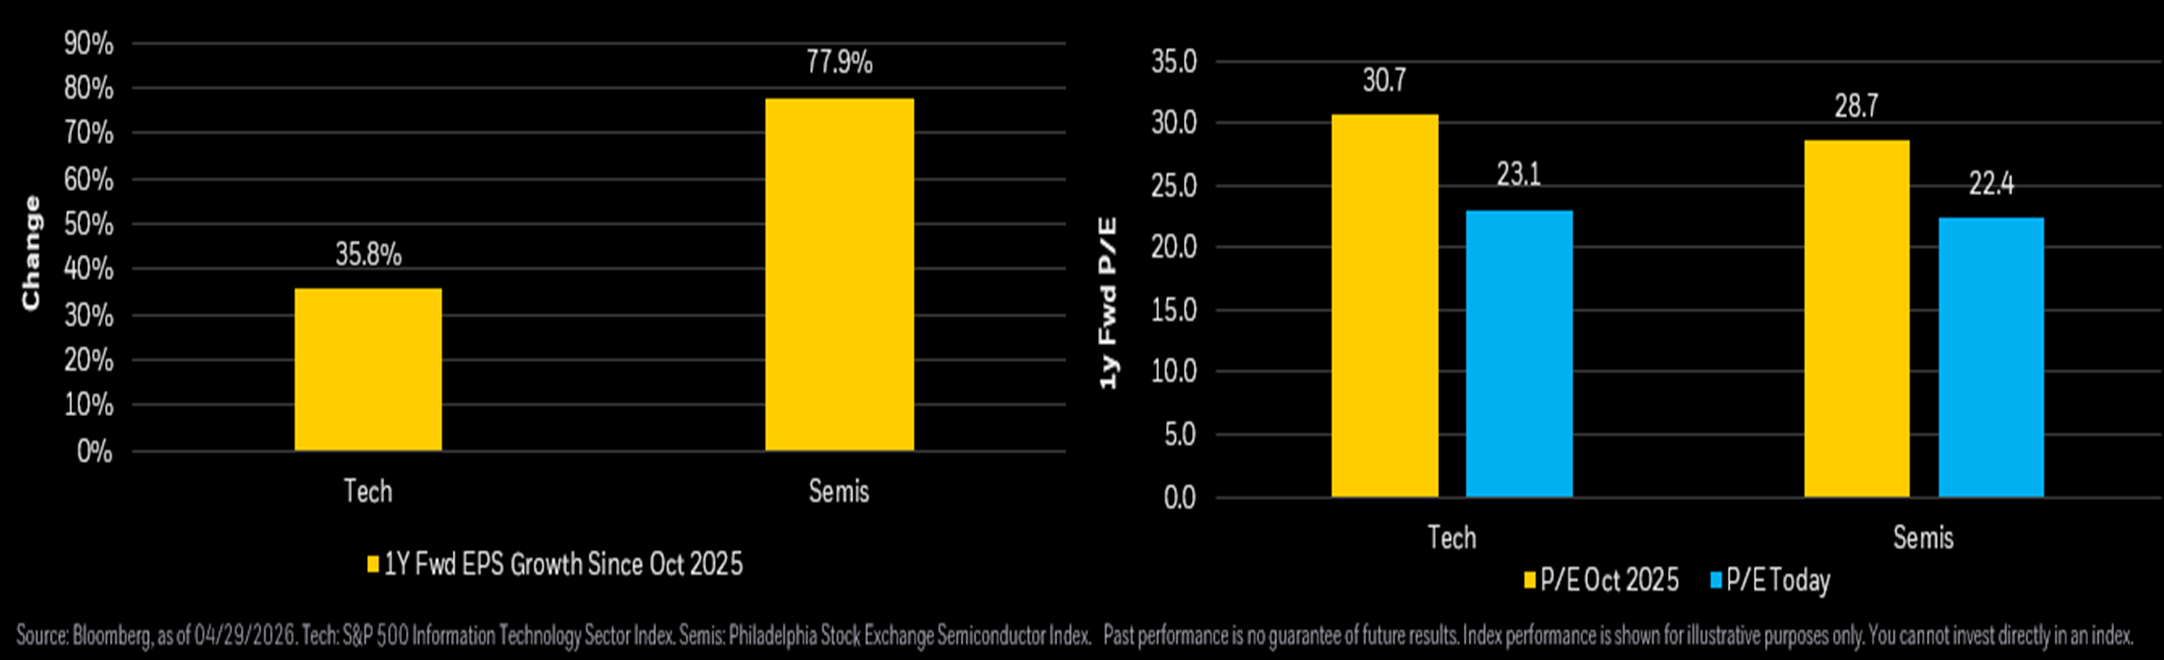
Earnings expectations soared over recent quarters while forward P/E has come down about 6-7 multiples. But as strong earnings are being continually realised from the surge in capex growth, significant multiple expansion in the hyperscalers could be a challenging prospect going forward, particularly if the macro risks begin to impede the strong earnings expectations in a way that investors begin to question AI capex ROIs and/or the monetisation timeline.
6. Macro Regime Is Shifting Again
A prolonged cost shock can tighten financial conditions even without further Fed hikes, and we could be shifting into a regime of tightening financial conditions, particularly as the consumer and the labour market looks to be resilient while inflation is sharply on the rise. Treasury yields have been on a rebound the last couple of weeks and while it may be difficult to argue for much more upside at this point, it certainly isn't a foregone possibility.
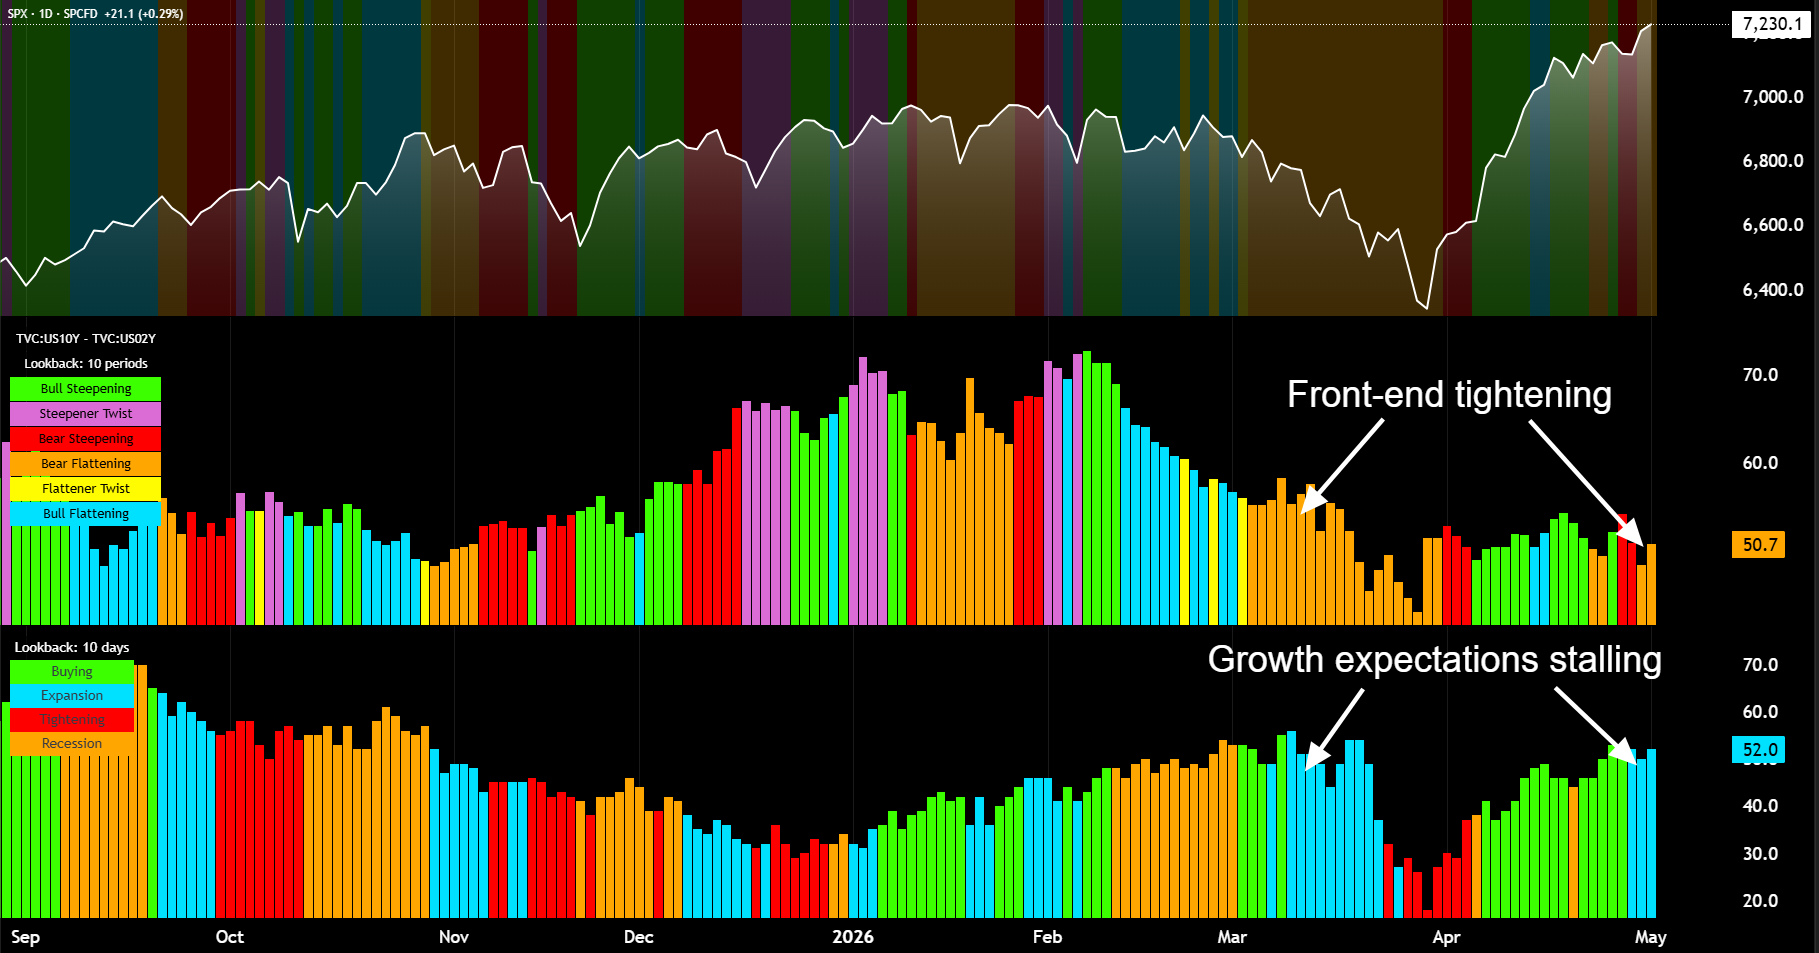
From our regime indicators we see the curve transitioning into bear regimes while the rebound in longer-term growth expectations has begun stalling out.
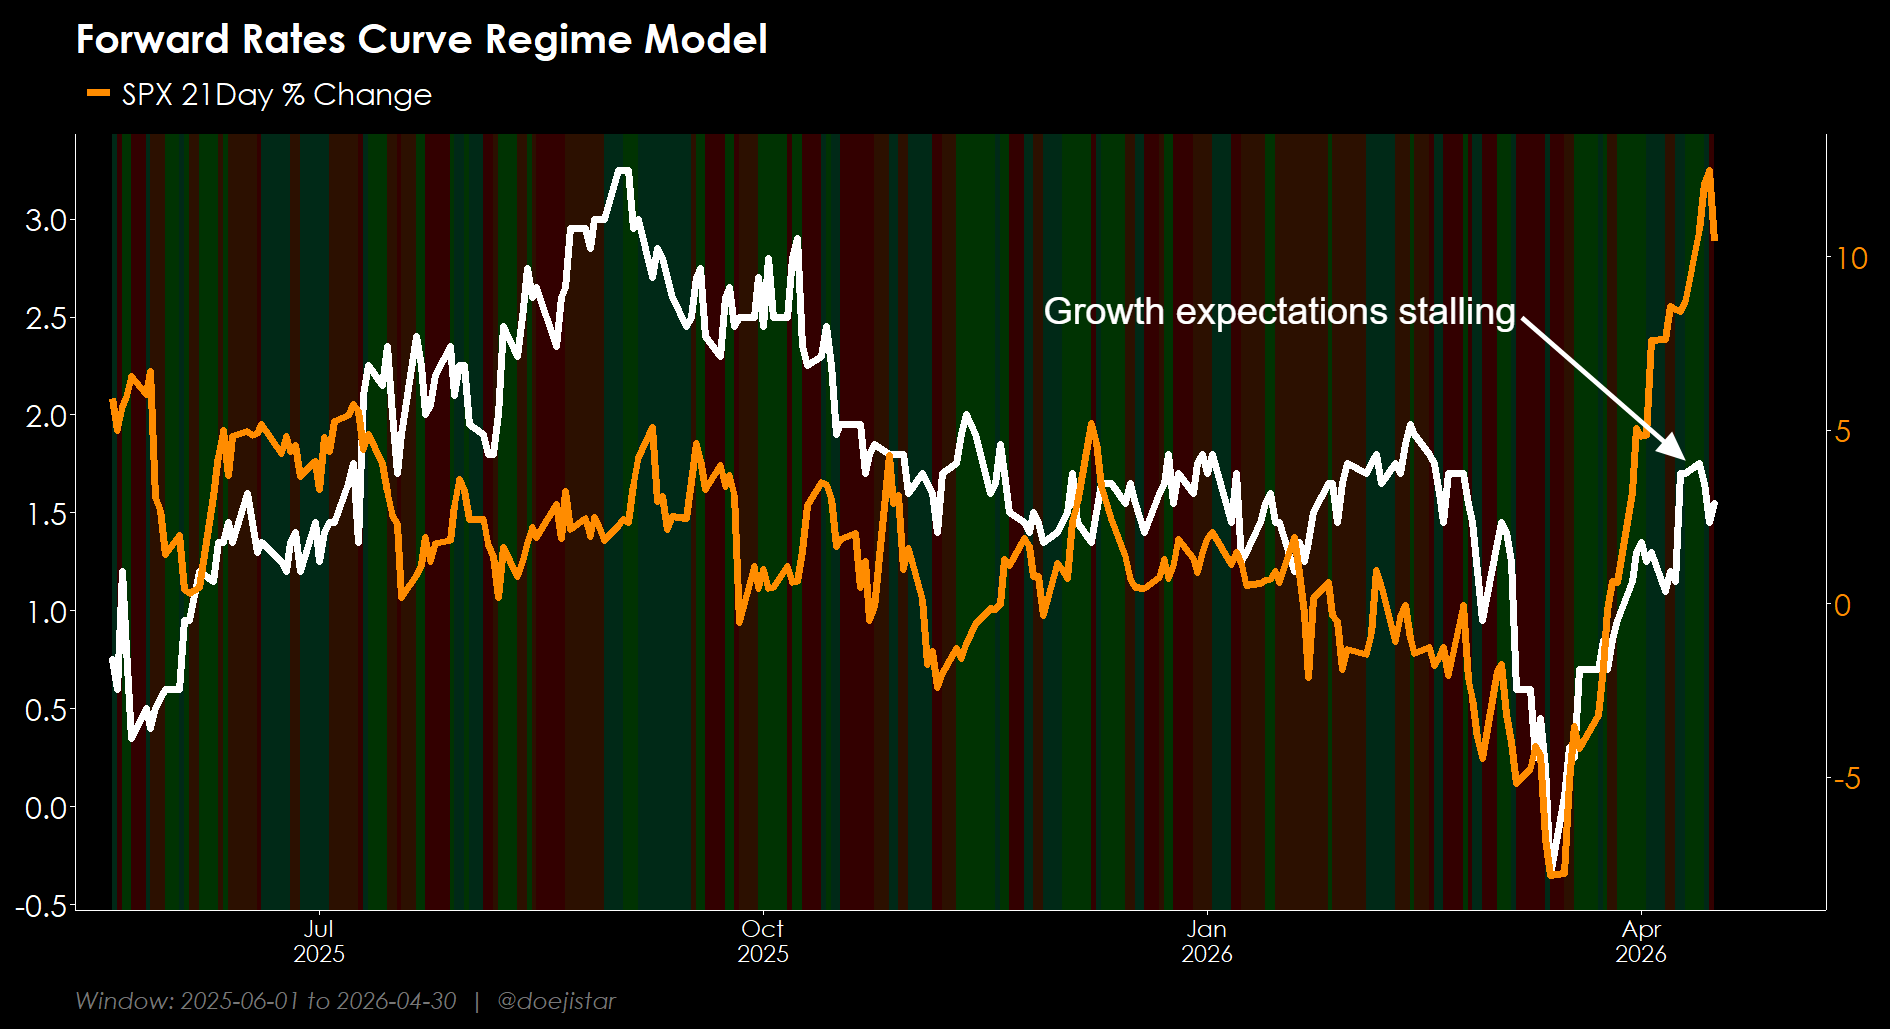
These would normally amount to a warning signal for risk assets and one that should not be taken lightly, since it would seem highly likely for this regime shift to continue without the upward pressure in energy prices dissipating.
Also, there is a decent amount of bond supply coming onto the market over the coming weeks and it will be interesting to see how strong auction demand will be at loftier yields. Recalling from my limited experience in this market, auctions have not seemed to have gone well when inflation is going up, which makes some sense as investors would demand a higher premium for higher inflation uncertainty and duration risk. In other words, increased borrowing coupled with weaker auctions could see term-premiums push higher to further support yields and tighter financial conditions.
IN CONCLUSION...
The bear case is ultimately centred around the idea that the market is priced for a benign outcome while the macro is shifting in a less benign direction. A prolonged energy shock increases stagflationary pressures, limits the Fed’s ability to cushion weakness, and challenges earnings/margin assumptions that have underpinned the rally. That becomes even more important with AI capex now such a large part of the equity narrative: if financial conditions tighten and project costs rise as the capex cycle peaks, investors may begin to question profitability.
If you enjoyed reading this, consider subscribing to stay in the loop, and consider being a Premium member if you'd like to capitalise on reactive analysis and opportunistic trading ideas in real-time via our highly active Discord server.
We'll also be launching a comprehensive MacroTechnicals course later this year designed to take retail-traders to a professional-level. It will cover both our Macro and Technical frameworks and processes, which can be applied across everything from understanding macro systematically, managing a stock portfolio, to swing trading and day trading markets effectively. Existing Premium members before launch will receive the course for free, so if that excites you, join now to lock in access to the course that will be priced substantially higher as a standalone product.
Let's dive deeper into the market Technicals and trade ideas across the major asset classes in the sections below.