Week4 MacroTechnicals - Complacency on Green Ice
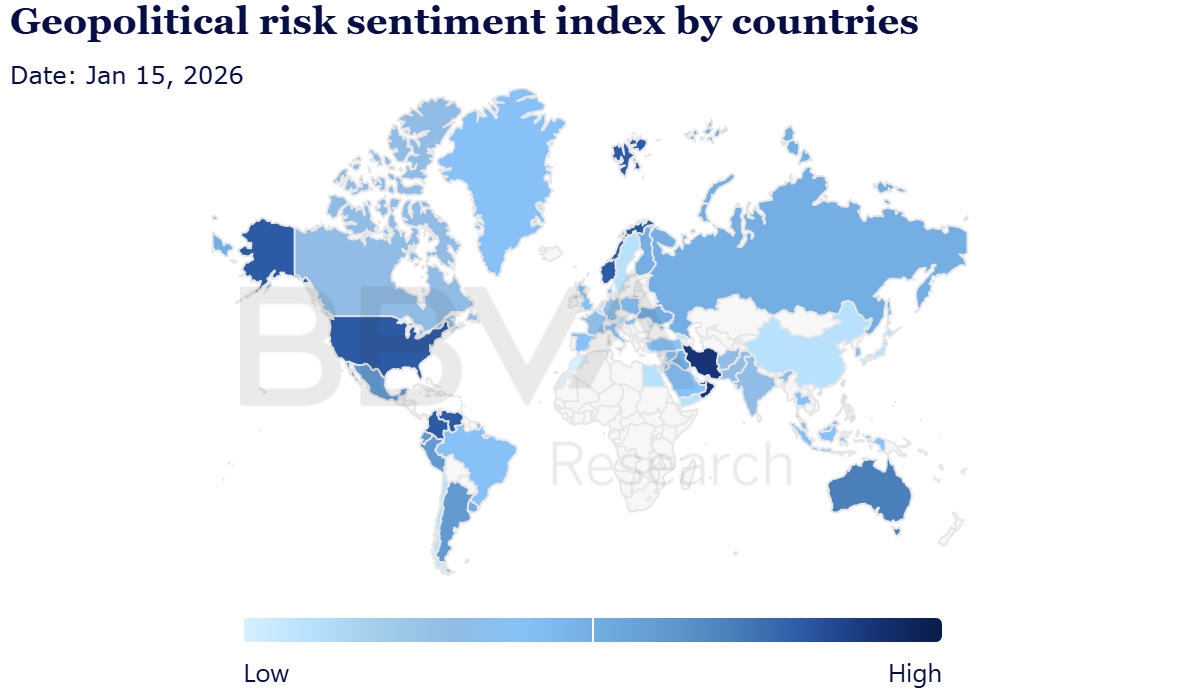
US data supports a no-rush Fed, equities broaden but short-vol trades look crowded and now see reasons to take some conviction on bearish risk ideas as geopolitics heats up.

US data supports a no-rush Fed, equities broaden but short-vol trades look crowded and now see reasons to take some conviction on bearish risk ideas as geopolitics heats up.
We start the week with some geopolitical escalations between the US and Europe, which threatens to reshape the NATO alliance as we know it.
Trump has made clear on his intentions to takeover Greenland in some way and Europe has preemptively sent over military to the Island in attempt to thwart and takeover attempts by Trump. Recent news reports show that the UK had joined Norway, Finland, Sweden, Netherlands, France and Germany in sending military over to Greenland at Denmark's request to join a reconnaissance group, or as Trump puts it - "for purposes unknown".
That has riled up Trump who responded with a long TruthSocial post claiming Greenland as essential for "Global Peace and Security" and that "World Peace is at stake!". Trump goes on to announce (in the name of "National Security of the United States, and the World at large"):
Starting on February 1st, 2026, all of the above mentioned Countries will be charged a 10% Tariff on any and all goods sent to the United States of America. On June 1st, 2026, the Tariff will be increased to 25%.
This Tariff will be due and payable until such time as a Deal is reached for the Complete and Total purchase of Greenland.
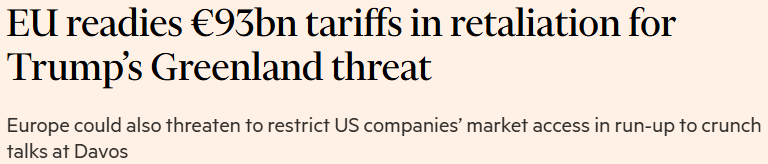
European leaders have responded firmly by saying tariffs are a 'mistake', 'complete wrong' and 'unacceptable' while mulling a €93 Billion worth of tariffs and retalitory measures aimed at restricting US business to the Block's market according to the FT.

I probably wouldn't bet on Trump being the first to flinch on this one...
The United States of America is immediately open to negotiation with Denmark and/or any of these Countries that have put so much at risk, despite all that we have done for them, including maximum protection, over so many decades.
[Oh, and] Thank you for your attention to this matter!
Macro
US INFLATION DATA
Latest monthly run rates show inflation to have been steady at +0.3% and +0.24% for core, roughly translating to annualised rates of 3.6% and 3% respectively.
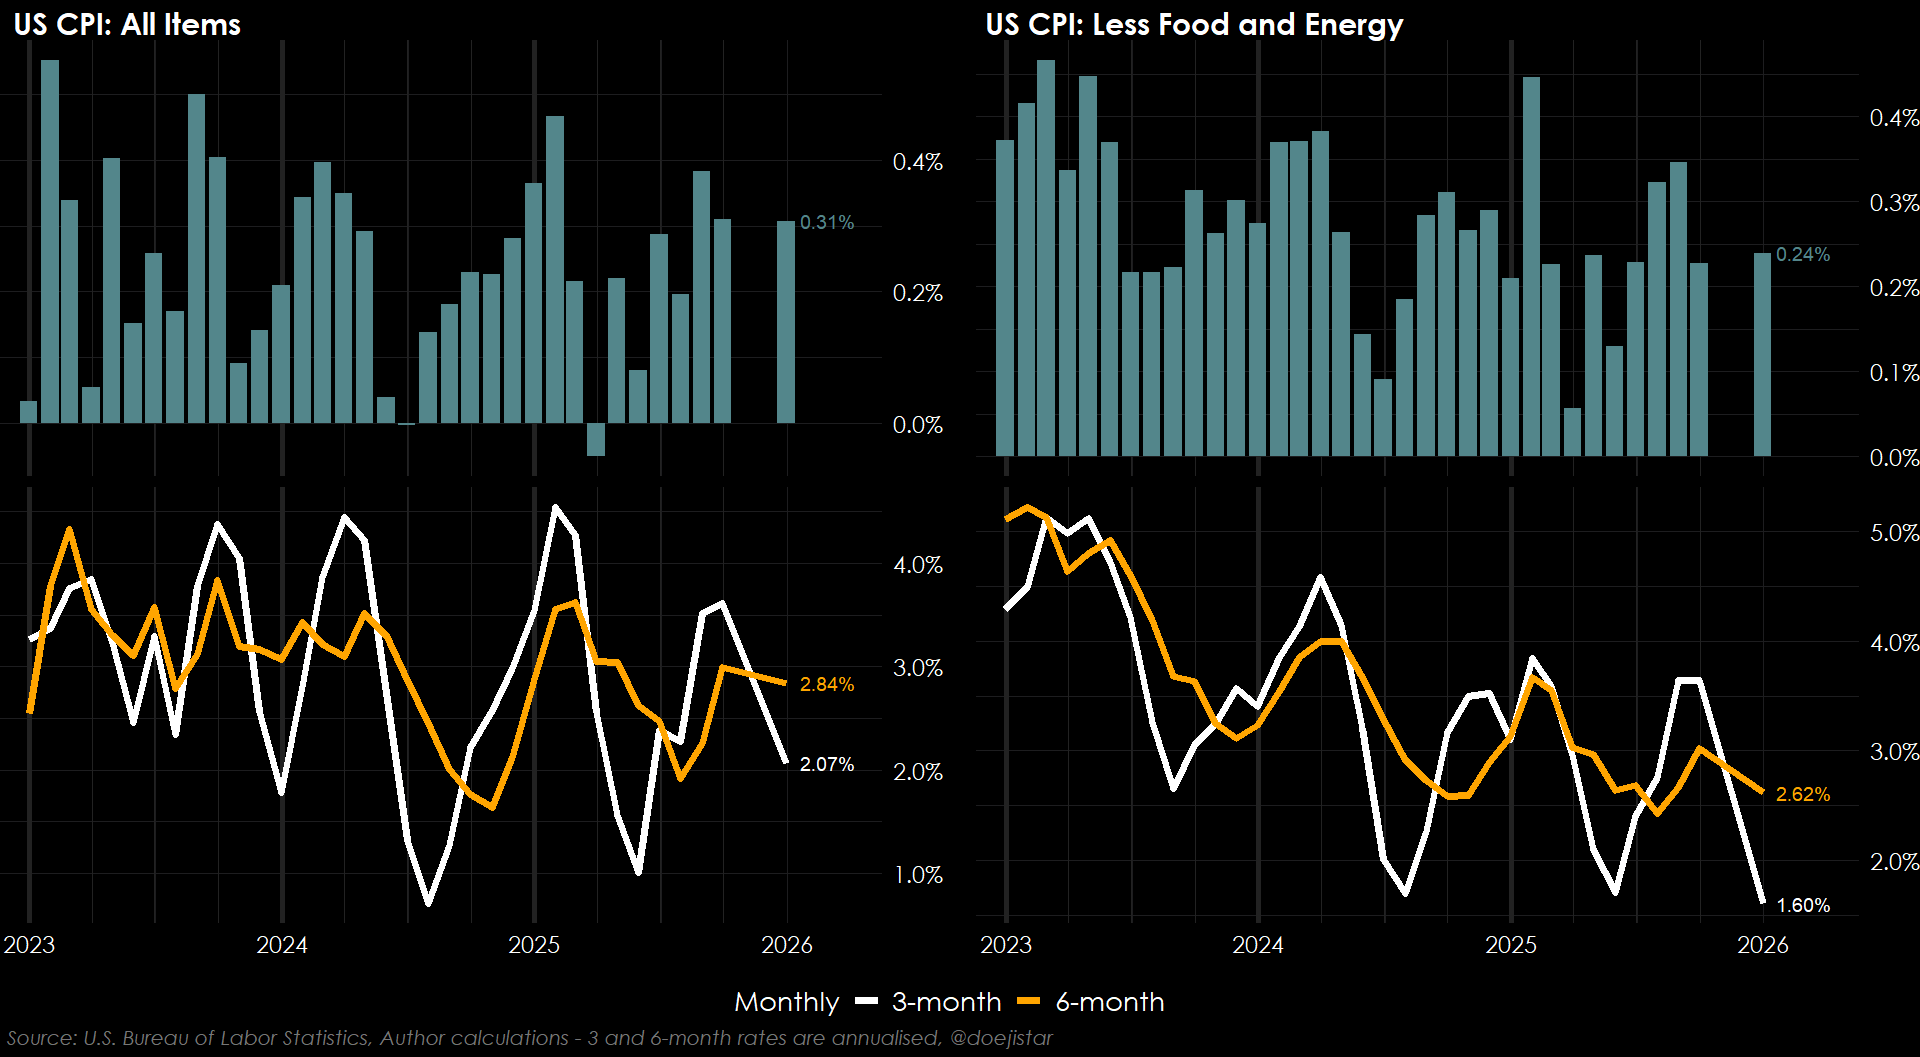
The most notable increase in prices was seen in food prices, while the Sticky CPI measure which has largely printed negative monthly prints in recent years saw a +1.9% monthly increase.
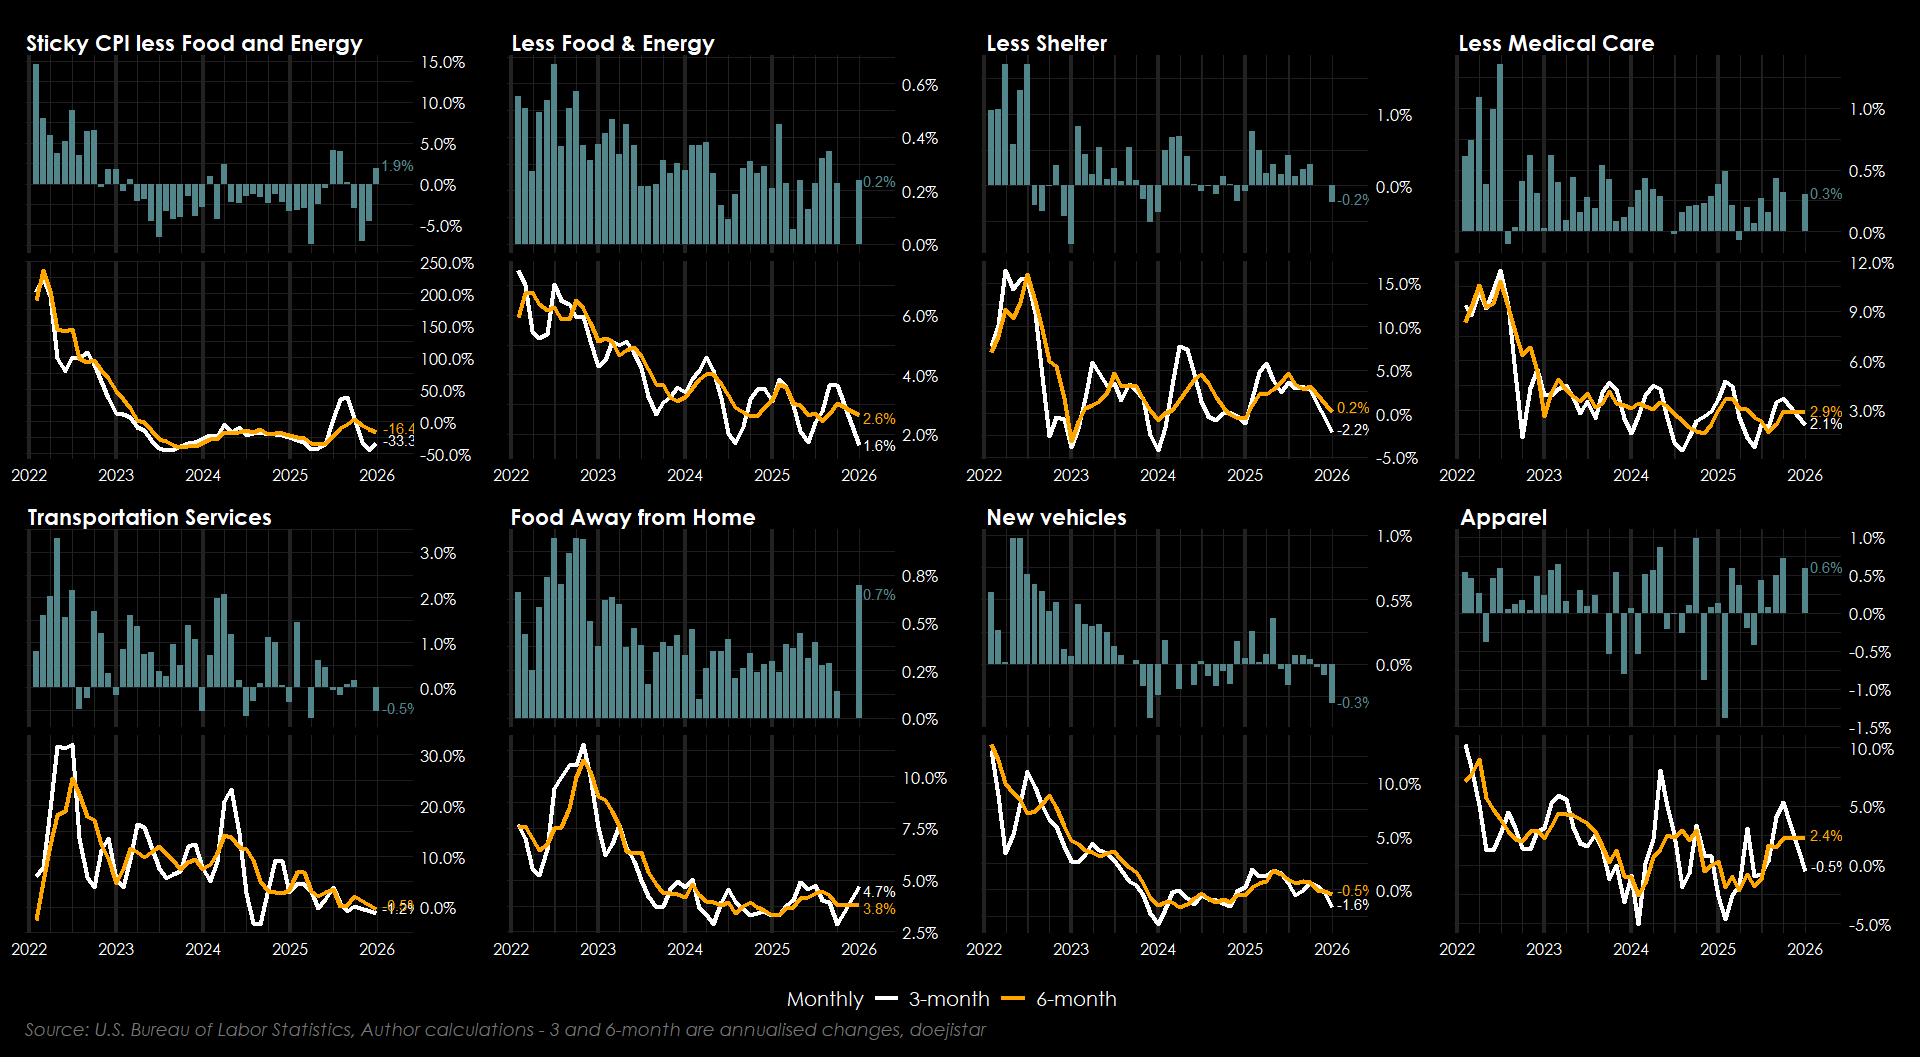
I would point out that I hold reservations about how much we can infer from the BLS data covering the Q4 period due to the Government shutdown. It has caused shortfalls in data collections that have forced the BLS to apply methods that could distort a true read of inflation. One known example was the zero'ing out of shelter inflation as a result of carrying forward prior month prices, while other examples suggest highly assumptive practices applied to other categories.
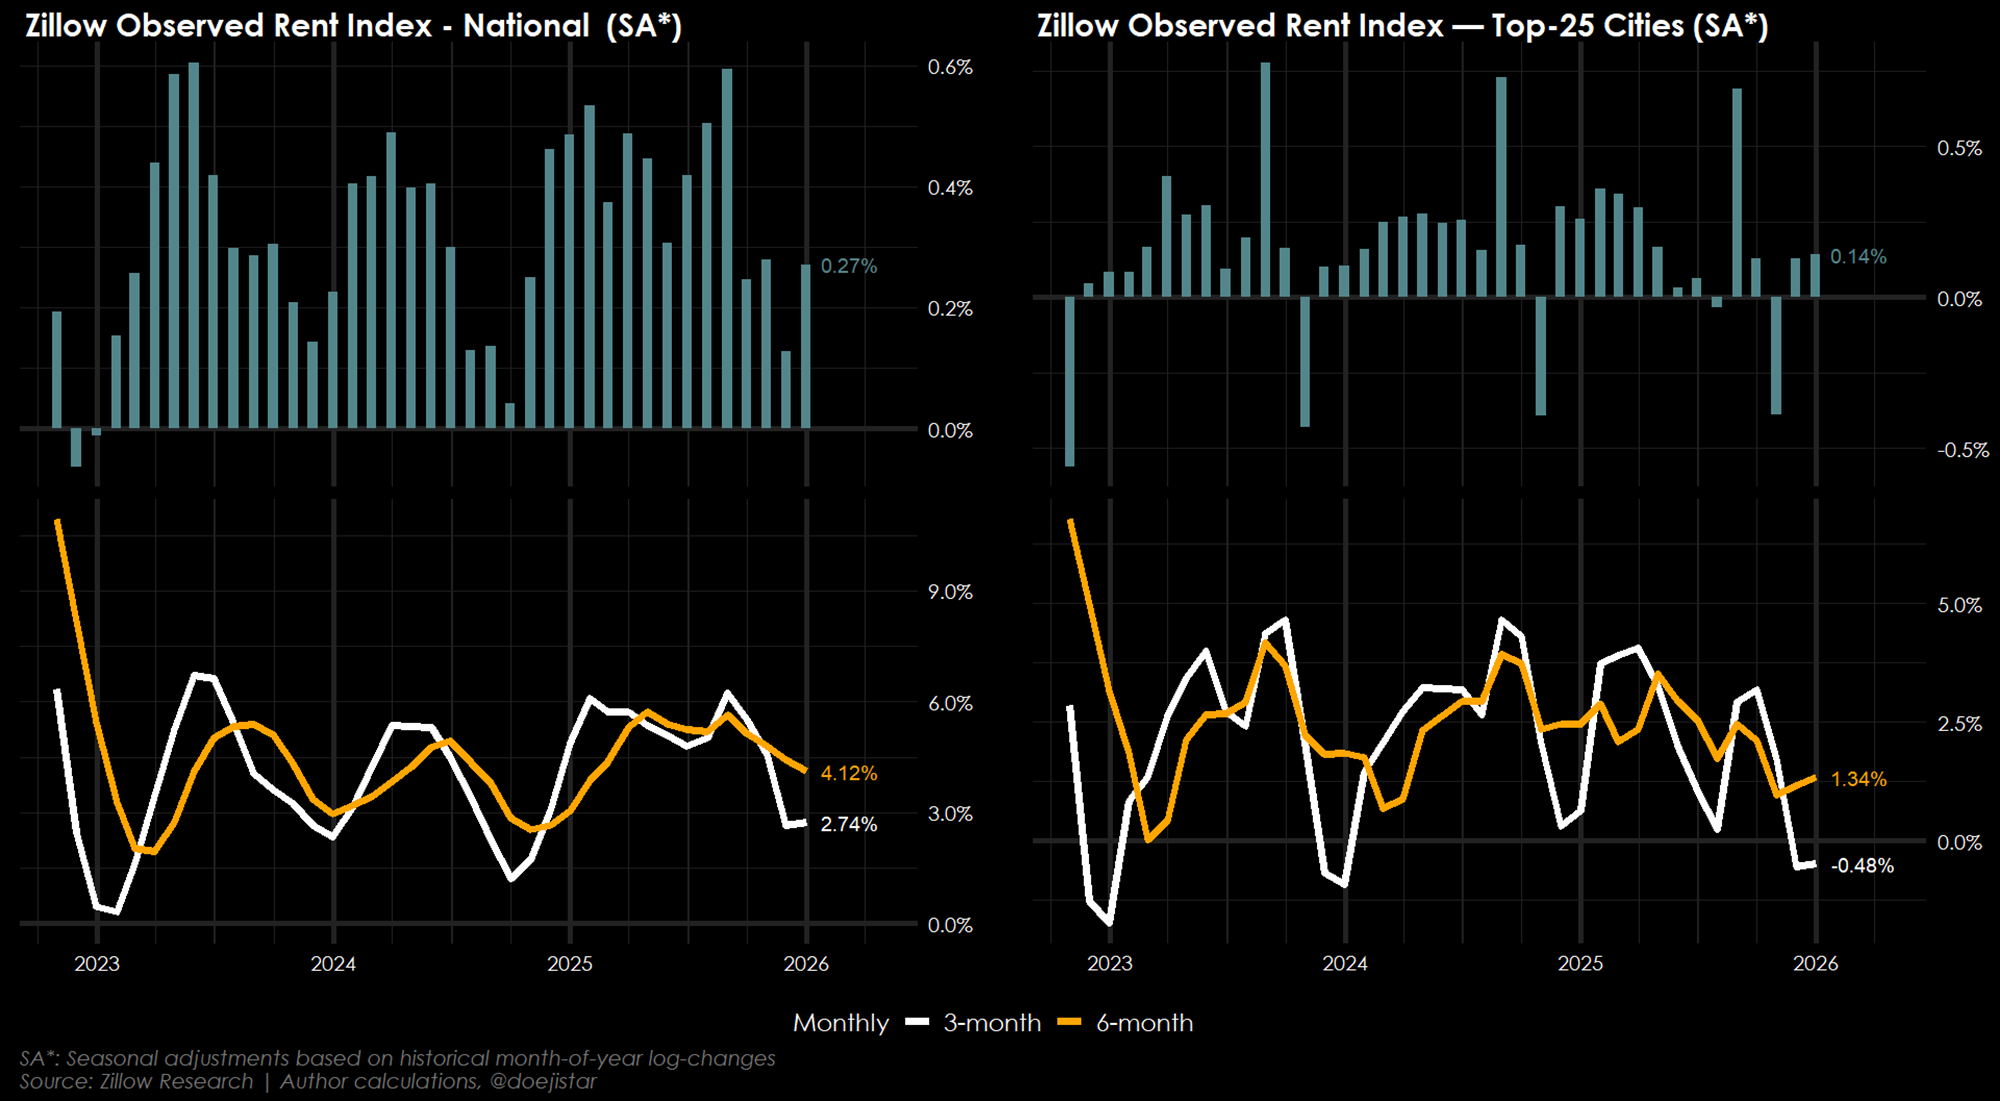
As for shelter inflation, Zillow data shows December as well as recent prior months to have been quite weak, but it isn't unusual for this period of year.
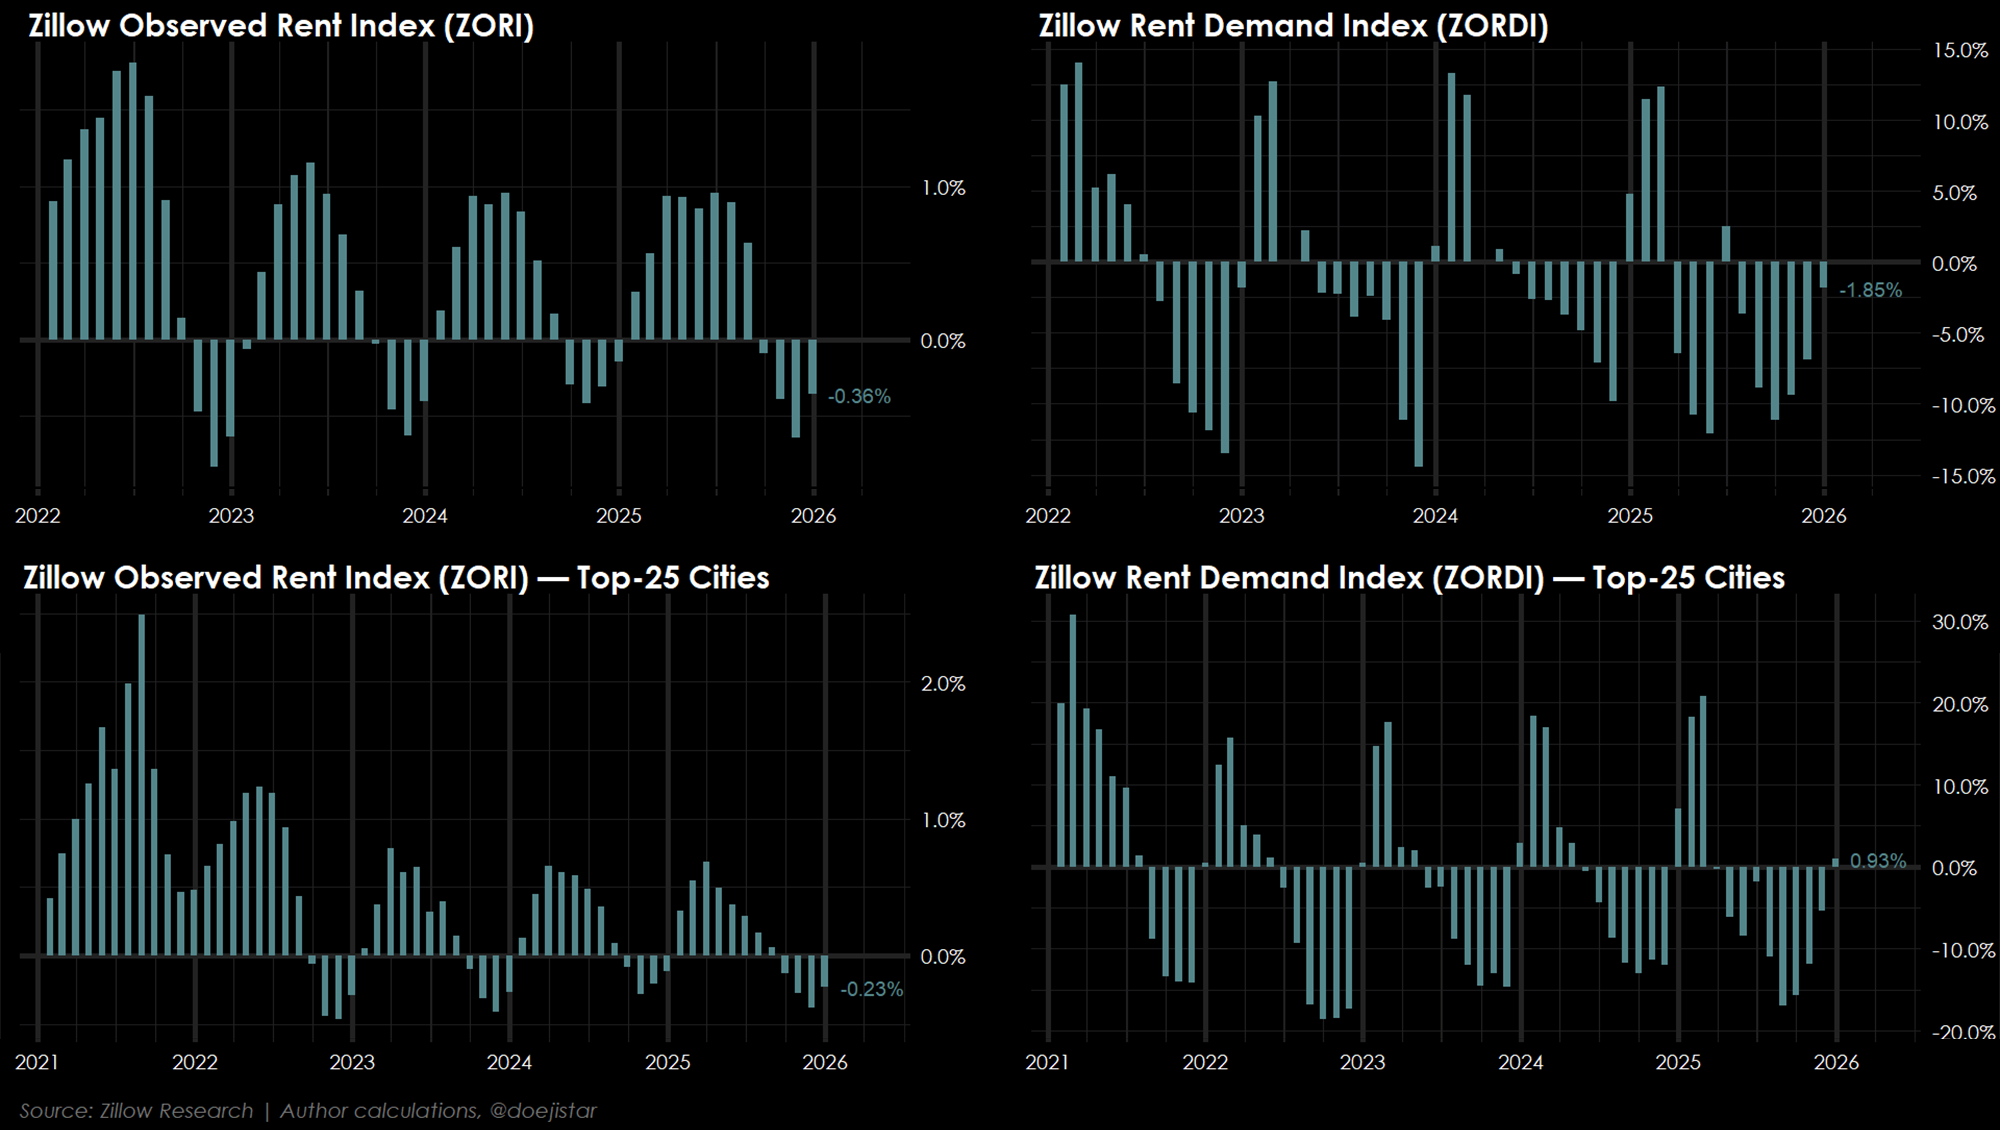
The above looks at the raw data while the below attempts adjust for the obvious seasonalities to get a sense of how strong or weak OER-type shelter-inflation trends are evolving, and we can see that shelter inflation is generally running at a decent 3-month pace at 2.74% on a national level, while the top-25 largest cities is looking comparatively weaker.
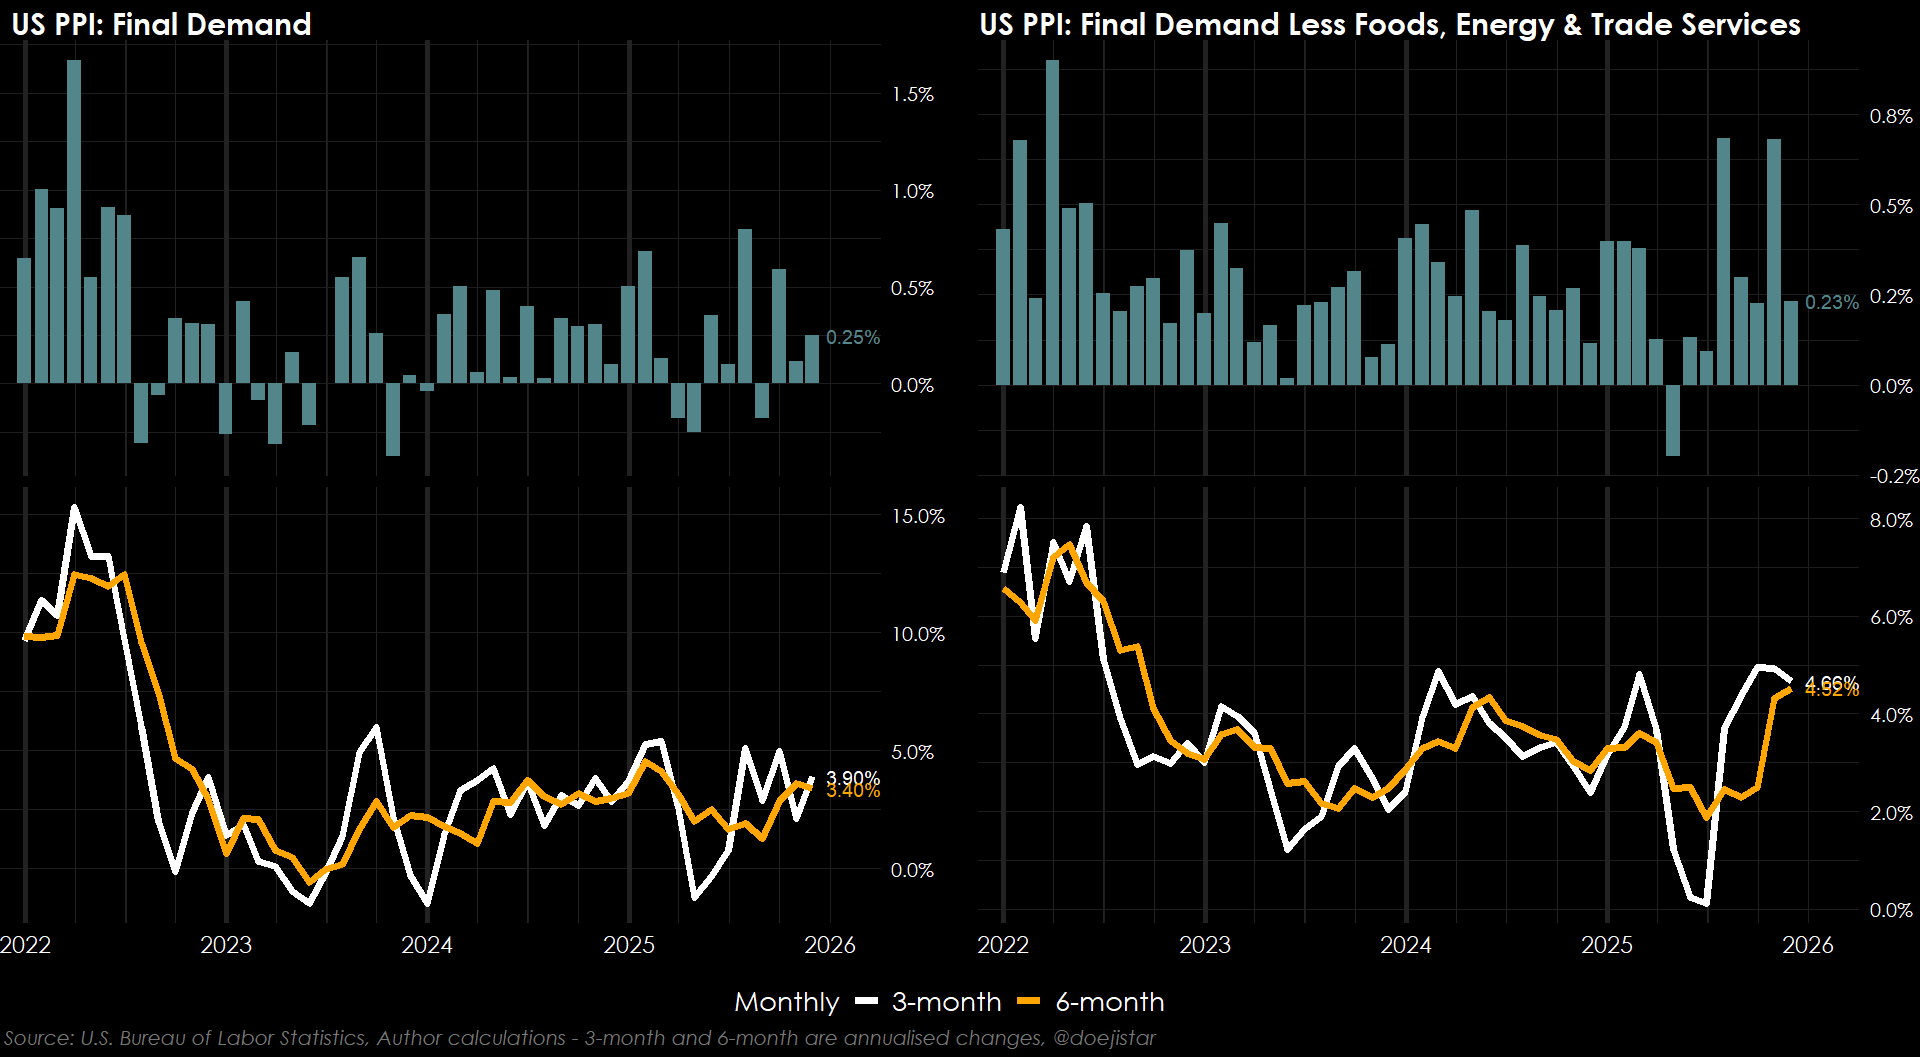
PPI rose +0.25% with goods prices jumping +0.9%, and 3 and 6 month annualised PPI now running at 3.9% and 3.4% respectively. Core trend remains firm with the 3 and 6month pace running above 4.5%.
December reports suggest inflation is somewhat softer than underlying trends but remains firm with some evidence of persistent stickiness - e.g. the sticky CPI basket saw a jump higher and PPI continues to point to ongoing upstream price pressures at the wholesale level. All in, I don't think these reports will change the FOMC's current stance and risk view on inflation.
RETAIL SALES
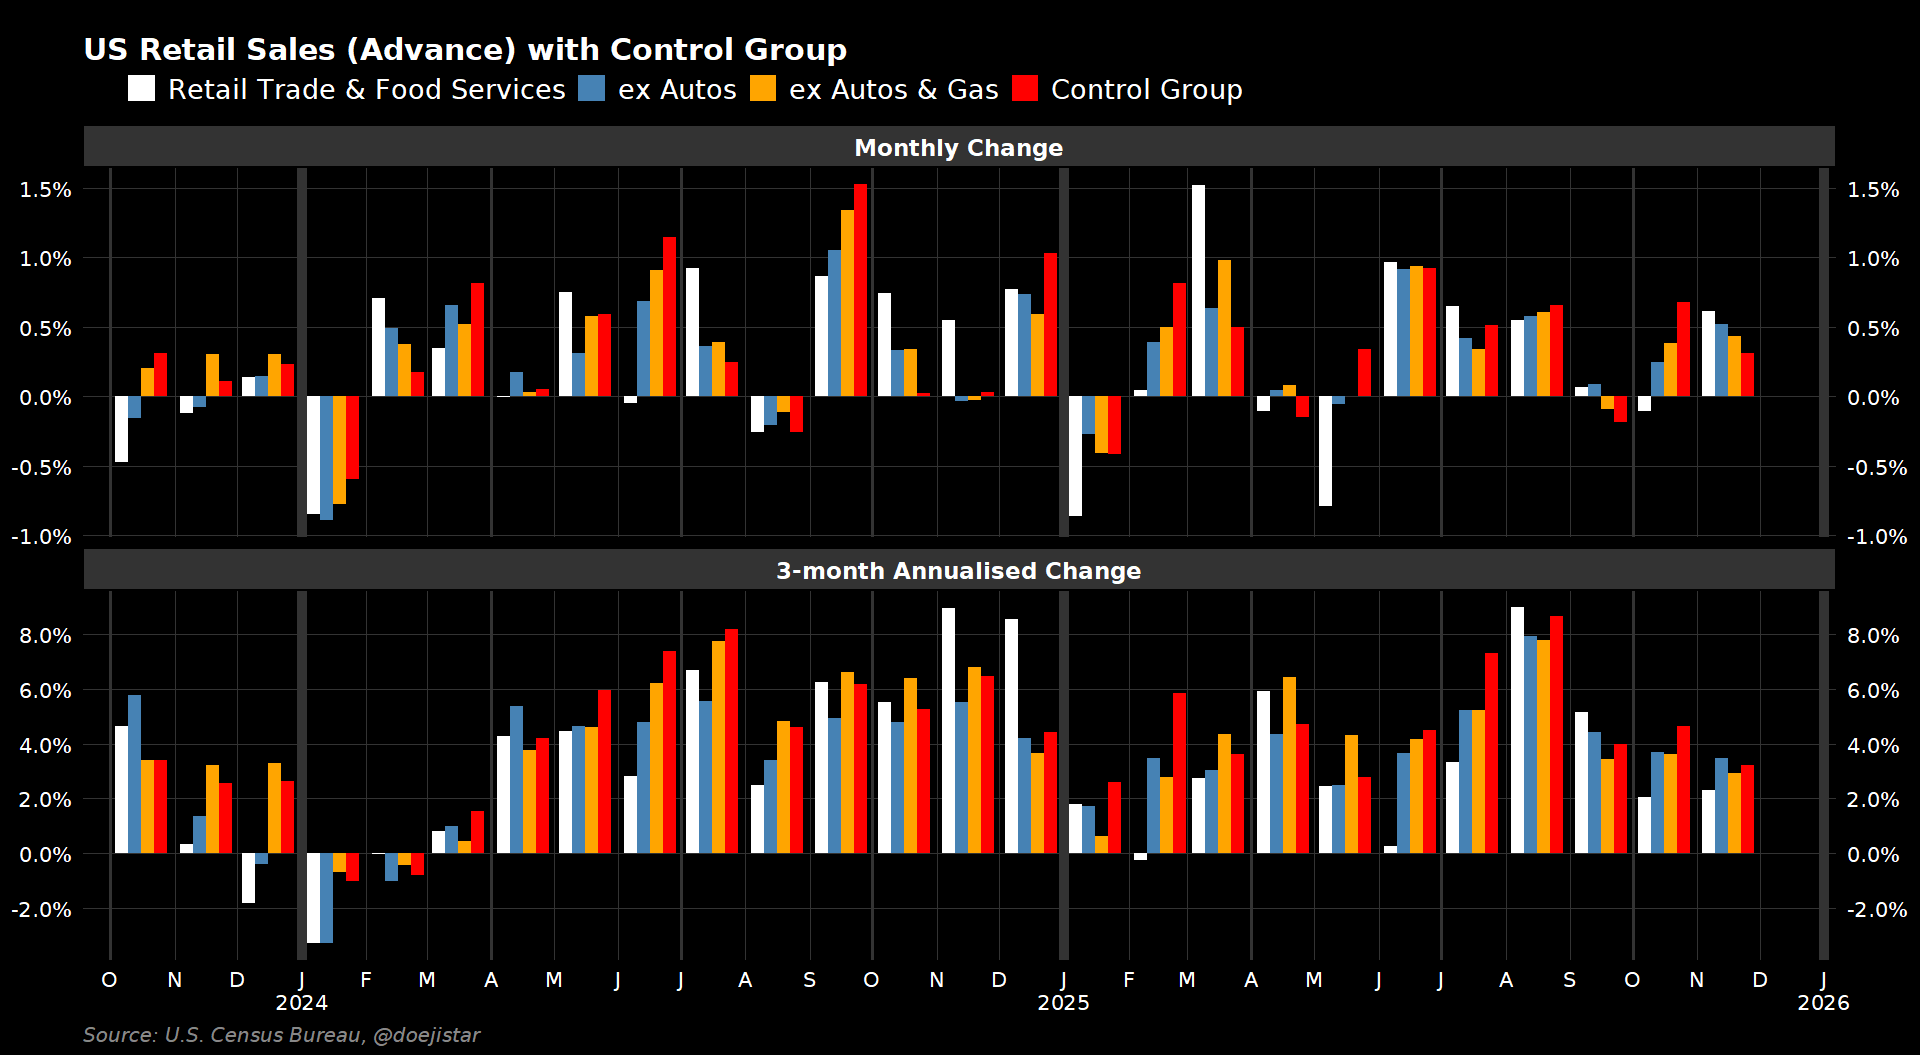
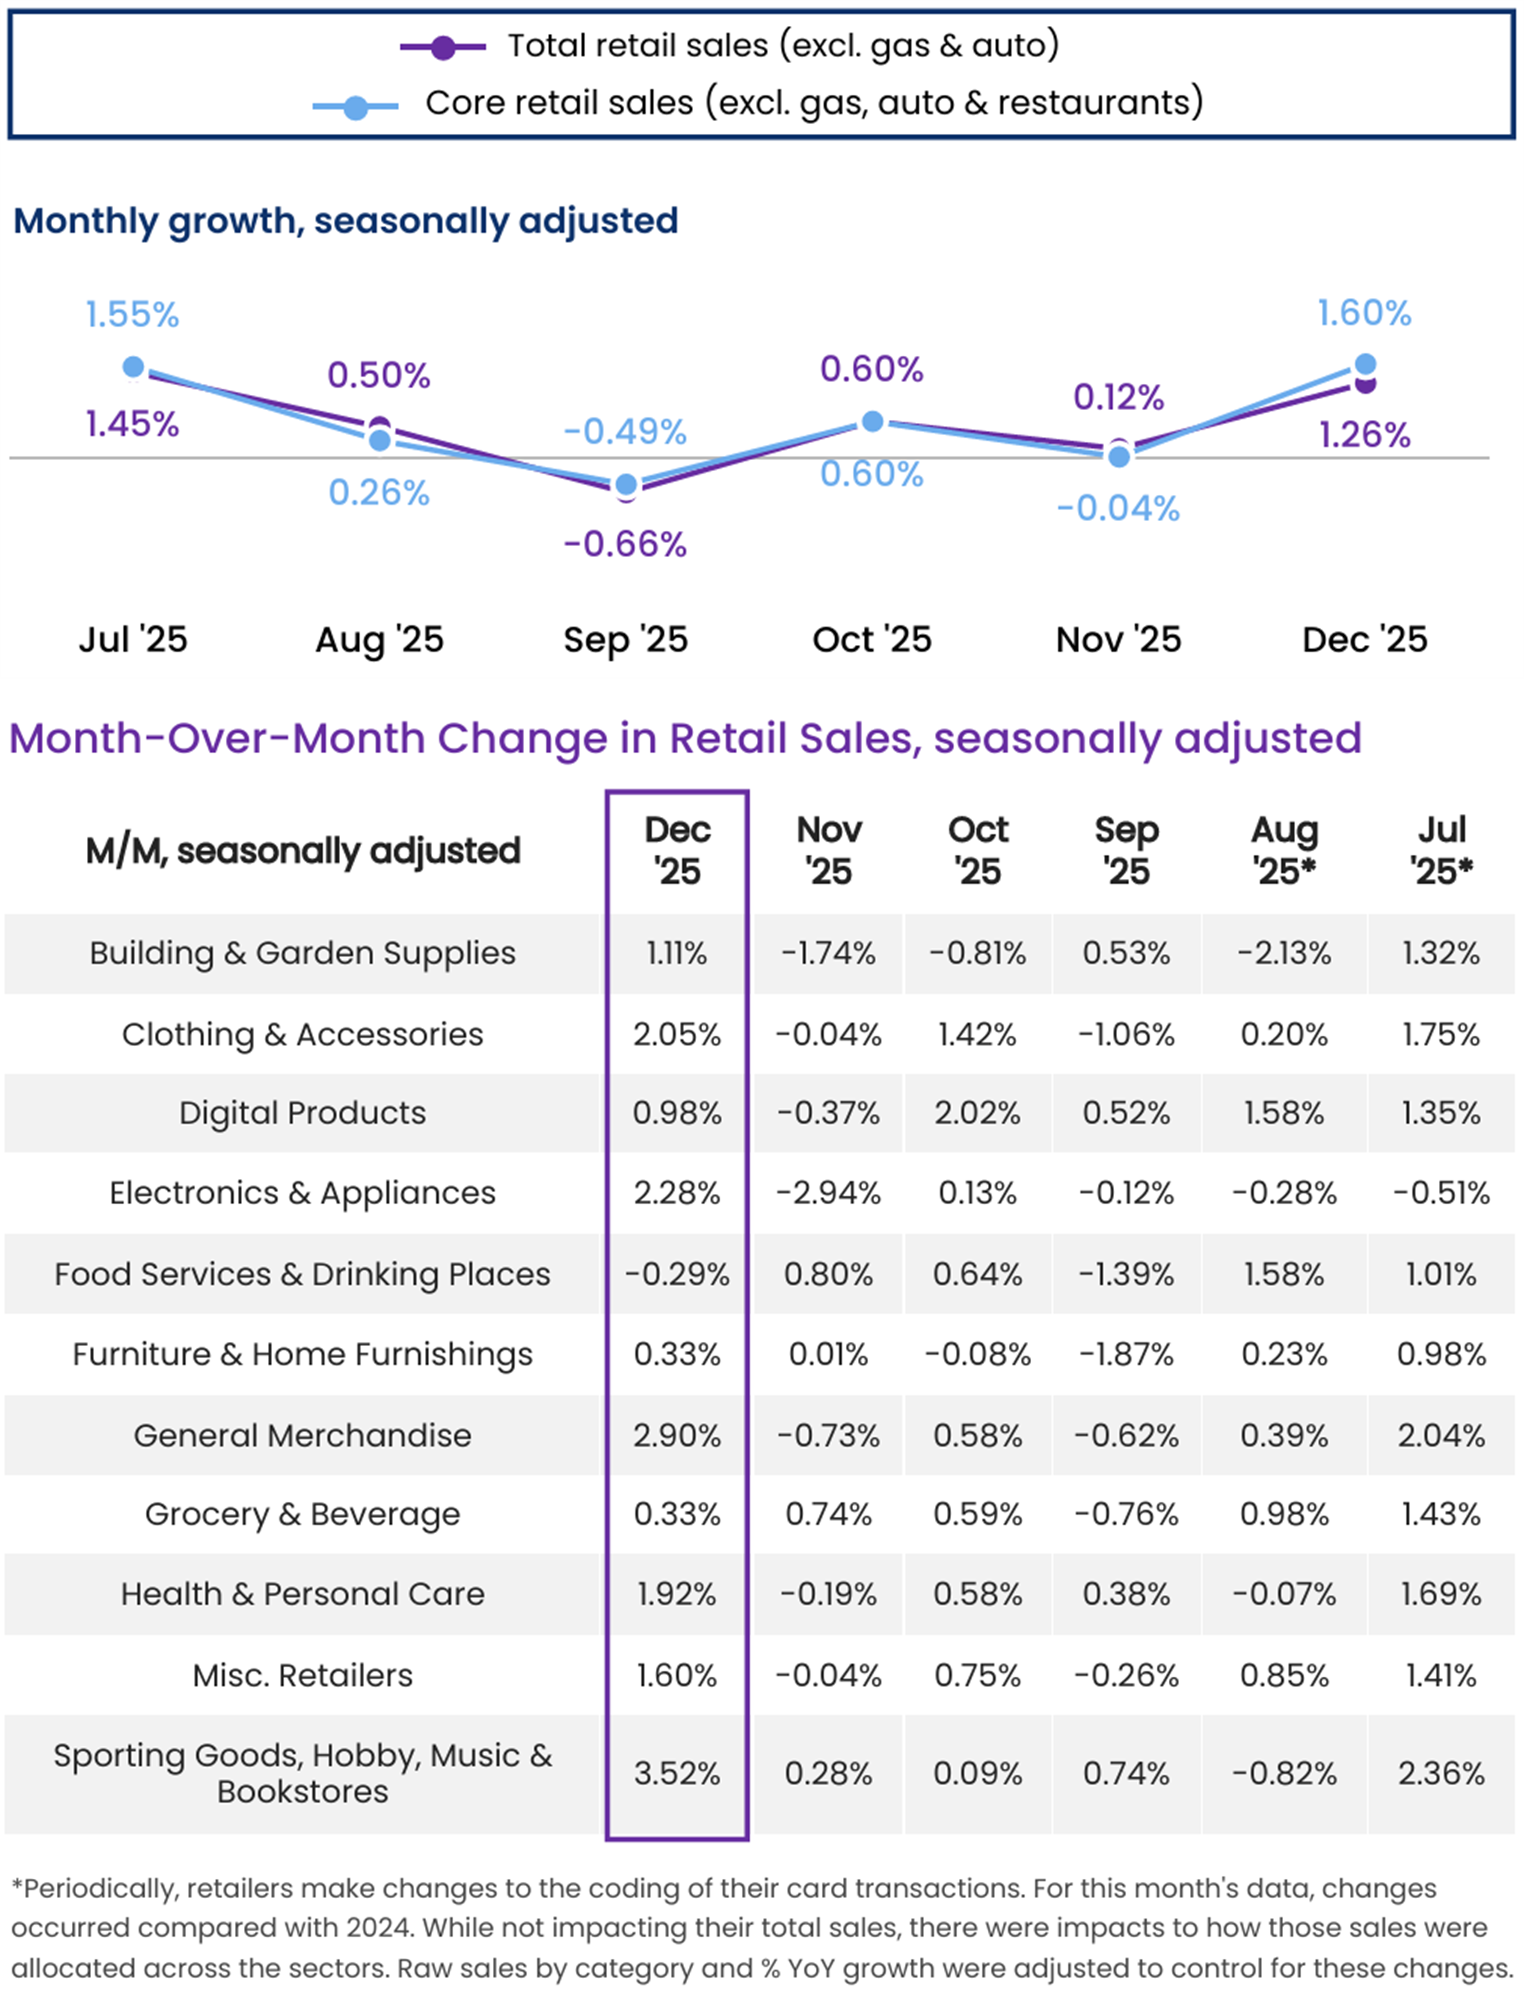
Retail sales increased +0.6% in November, beating economist expectations of +0.4% and after October was revised down to -0.1% from 0.0%. The control group measure which feeds into GDP's consumer spending component stayed firm with a +0.4% though the prior month saw a downward revision to +0.6% from +0.8%.
More up-to-date data from the National Retail Federation shows strong spending during December, the highest monthly increase since July.
SMALL BUSINESS SURVEY
NFIB Small Business Optimism Index rose 0.5 to 99.5 in December, staying above its 52-year average of 98 for a second straight month with businesses reporting increased profitability and sales also for a second straight month. Expectations for better business conditions jumped 9 points to a net 24% to put its first monthly rise since July.
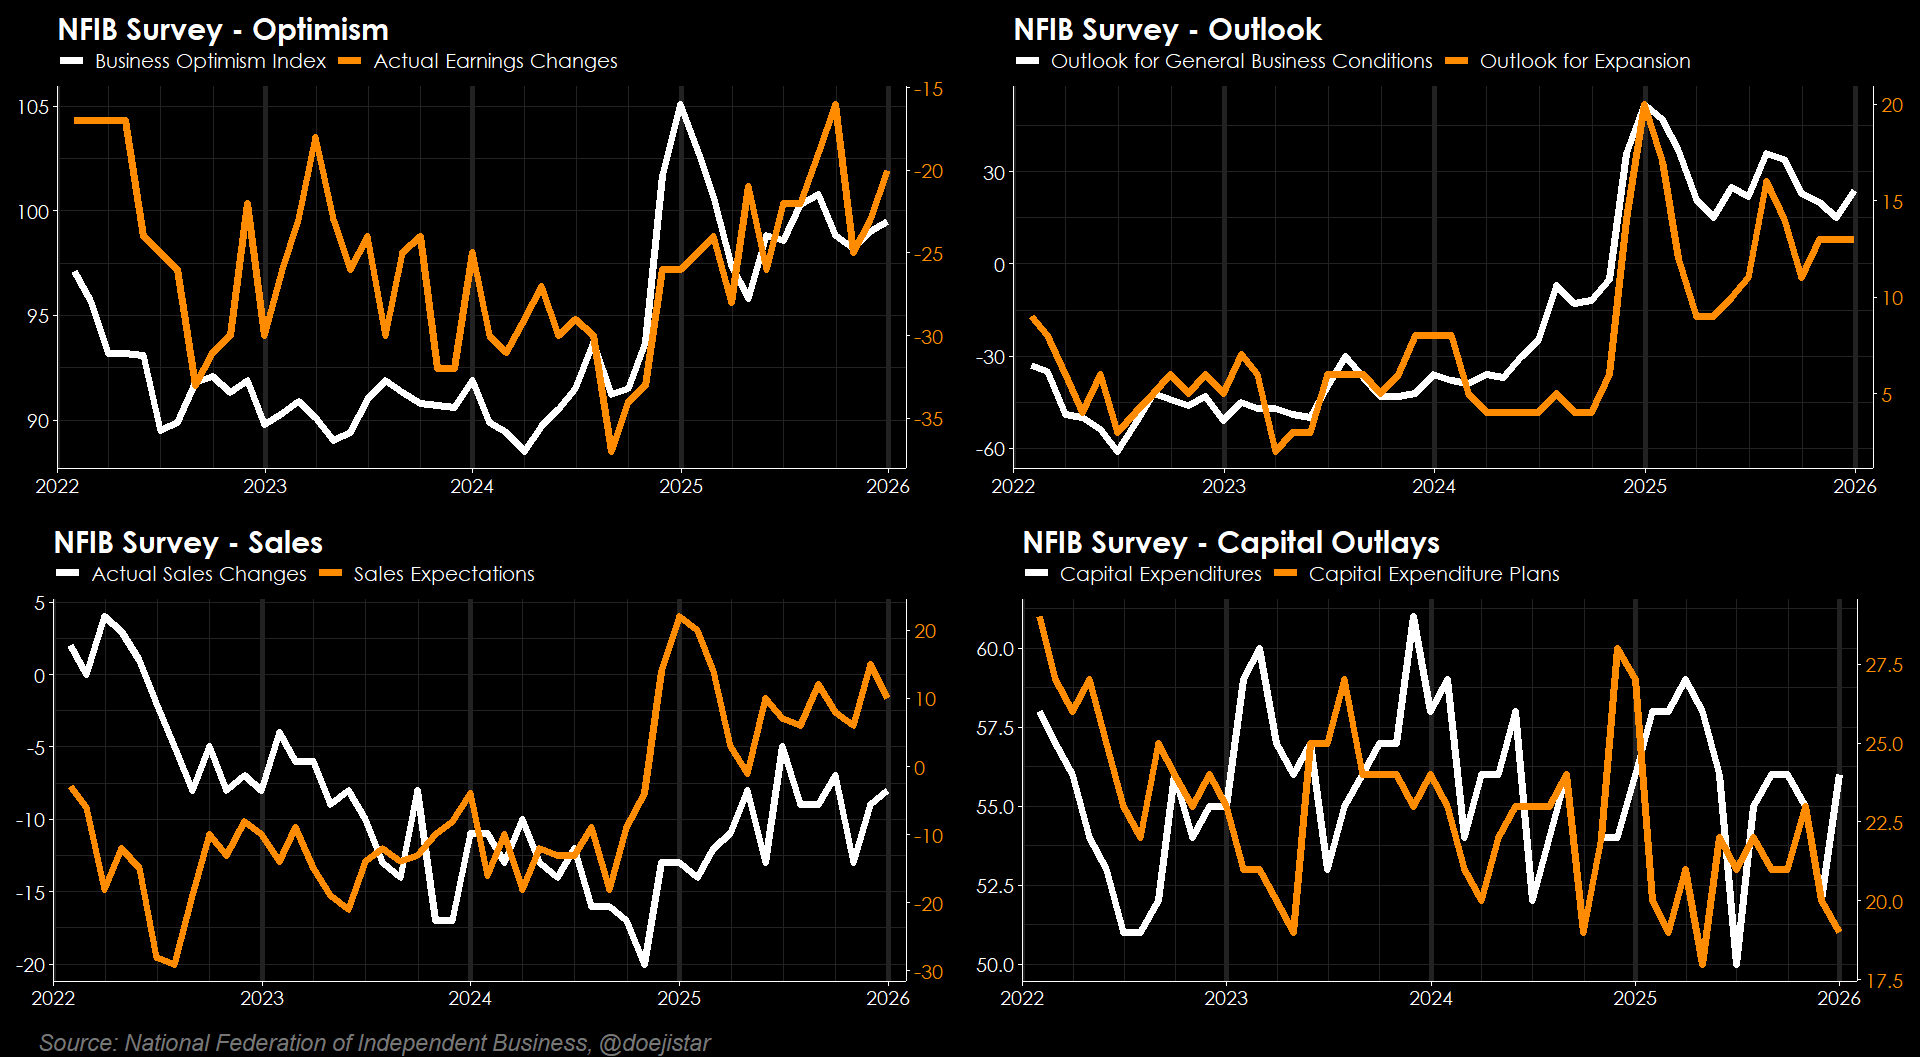
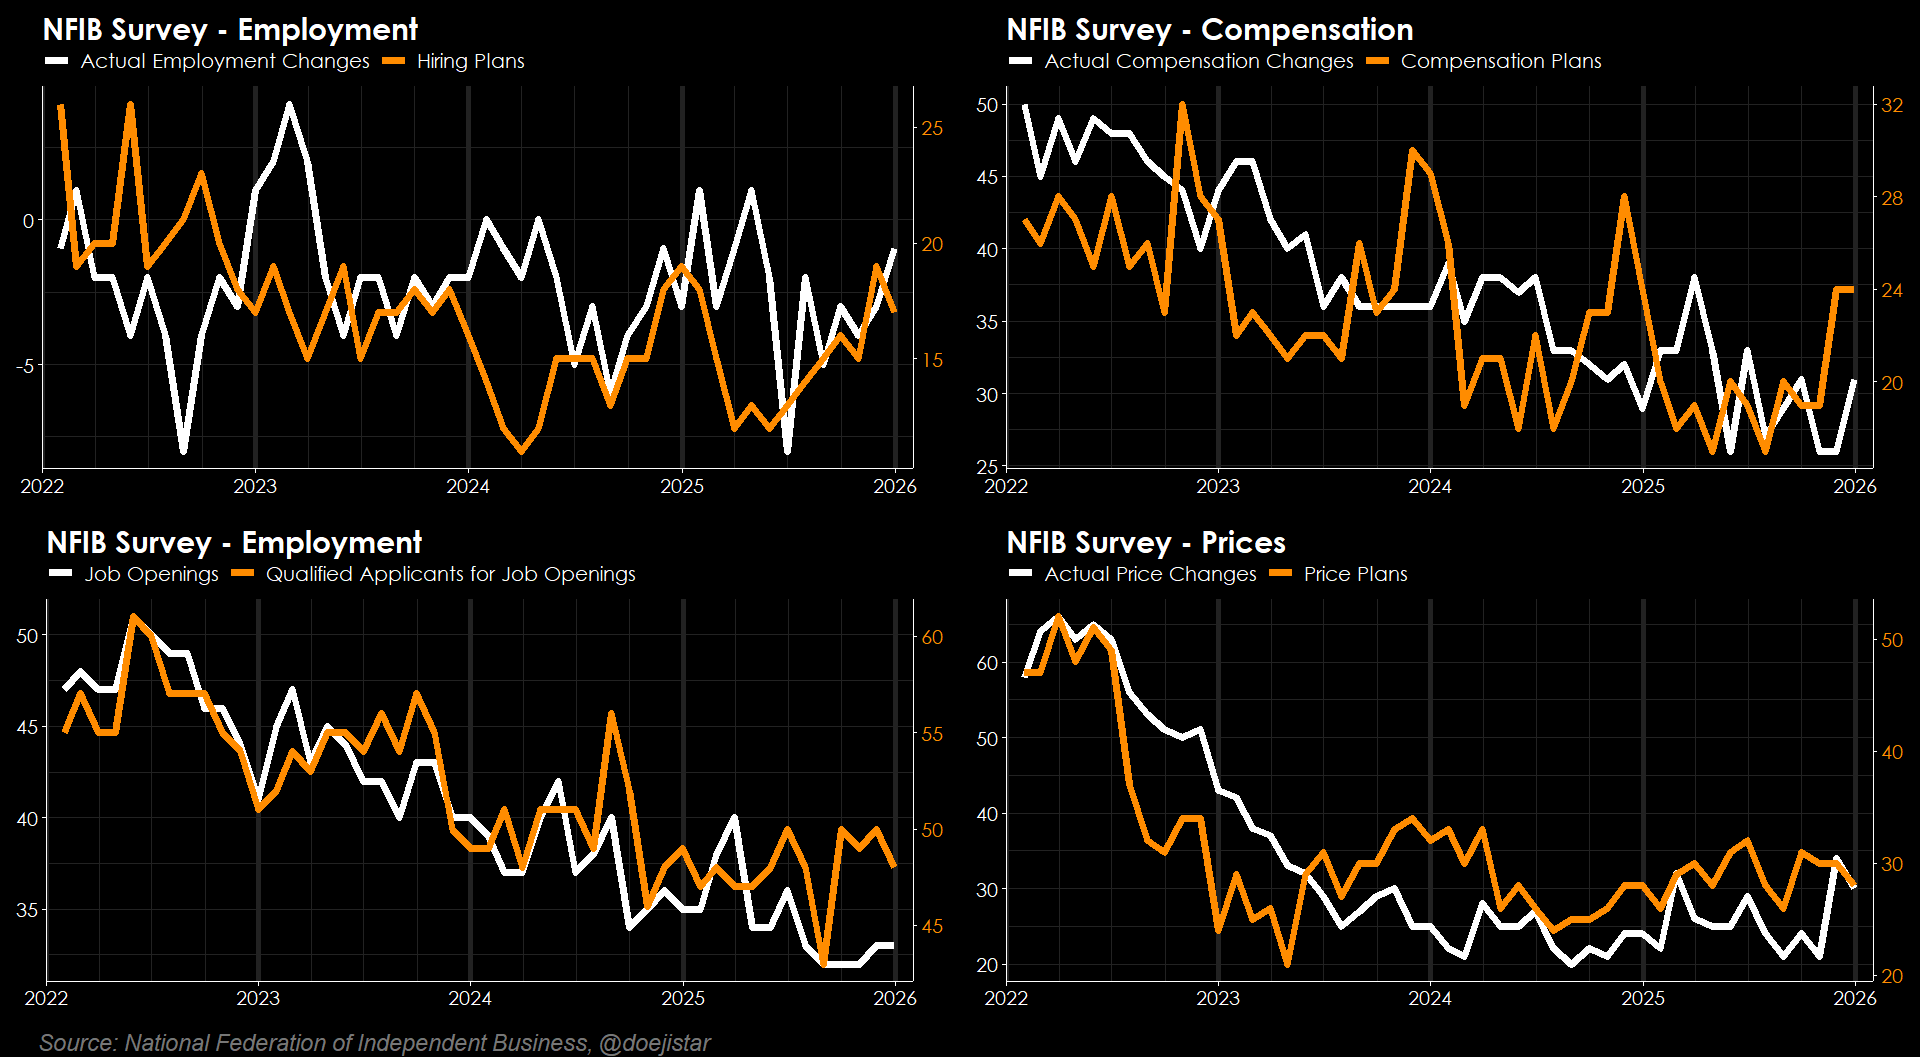
Actual employment changes continued to pick up and general labour market trends at the small business level continue to hold its improving trend, while both actual and planned price changes dipped in December.
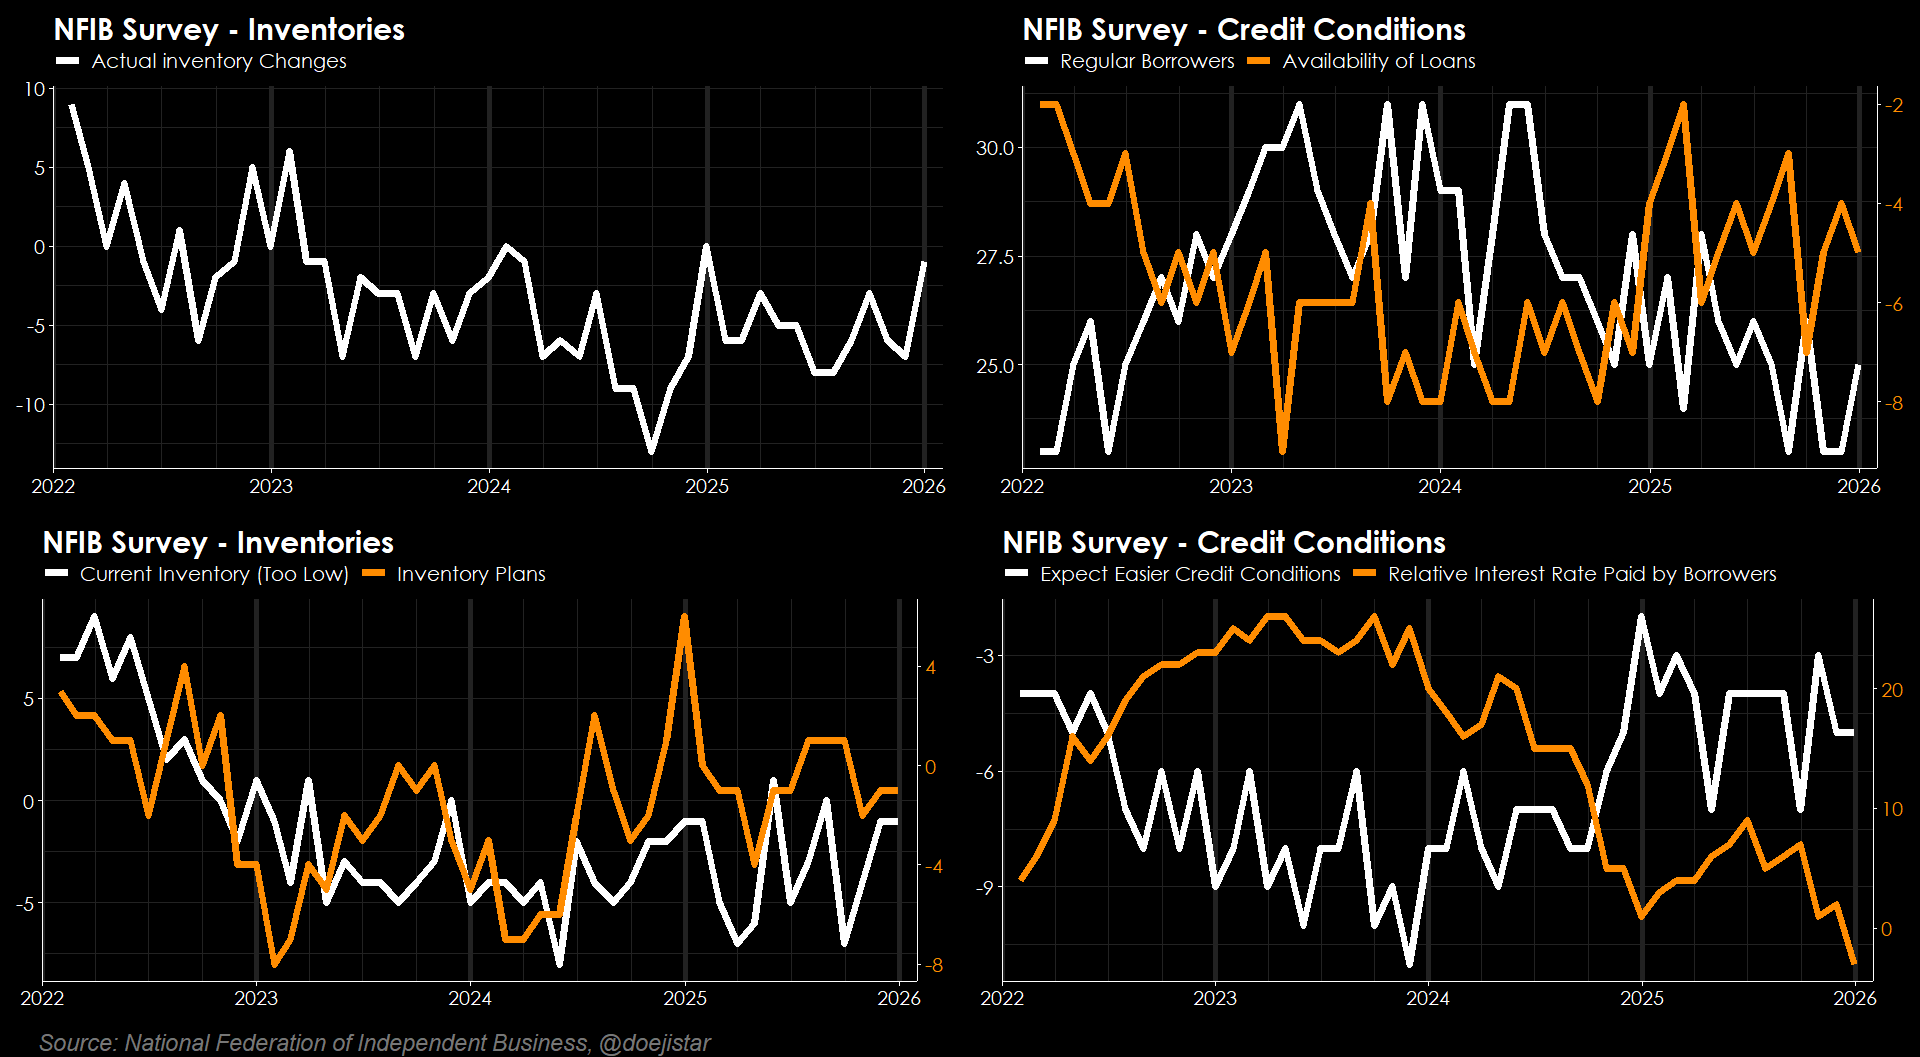
Inventory improved slightly to its best level of 2025, while credit conditions appear stable and loosening particularly with the Relative Interest Rate Paid by Borrowers (higher or lower compared to months ago) reading being the lowest in 5-years.
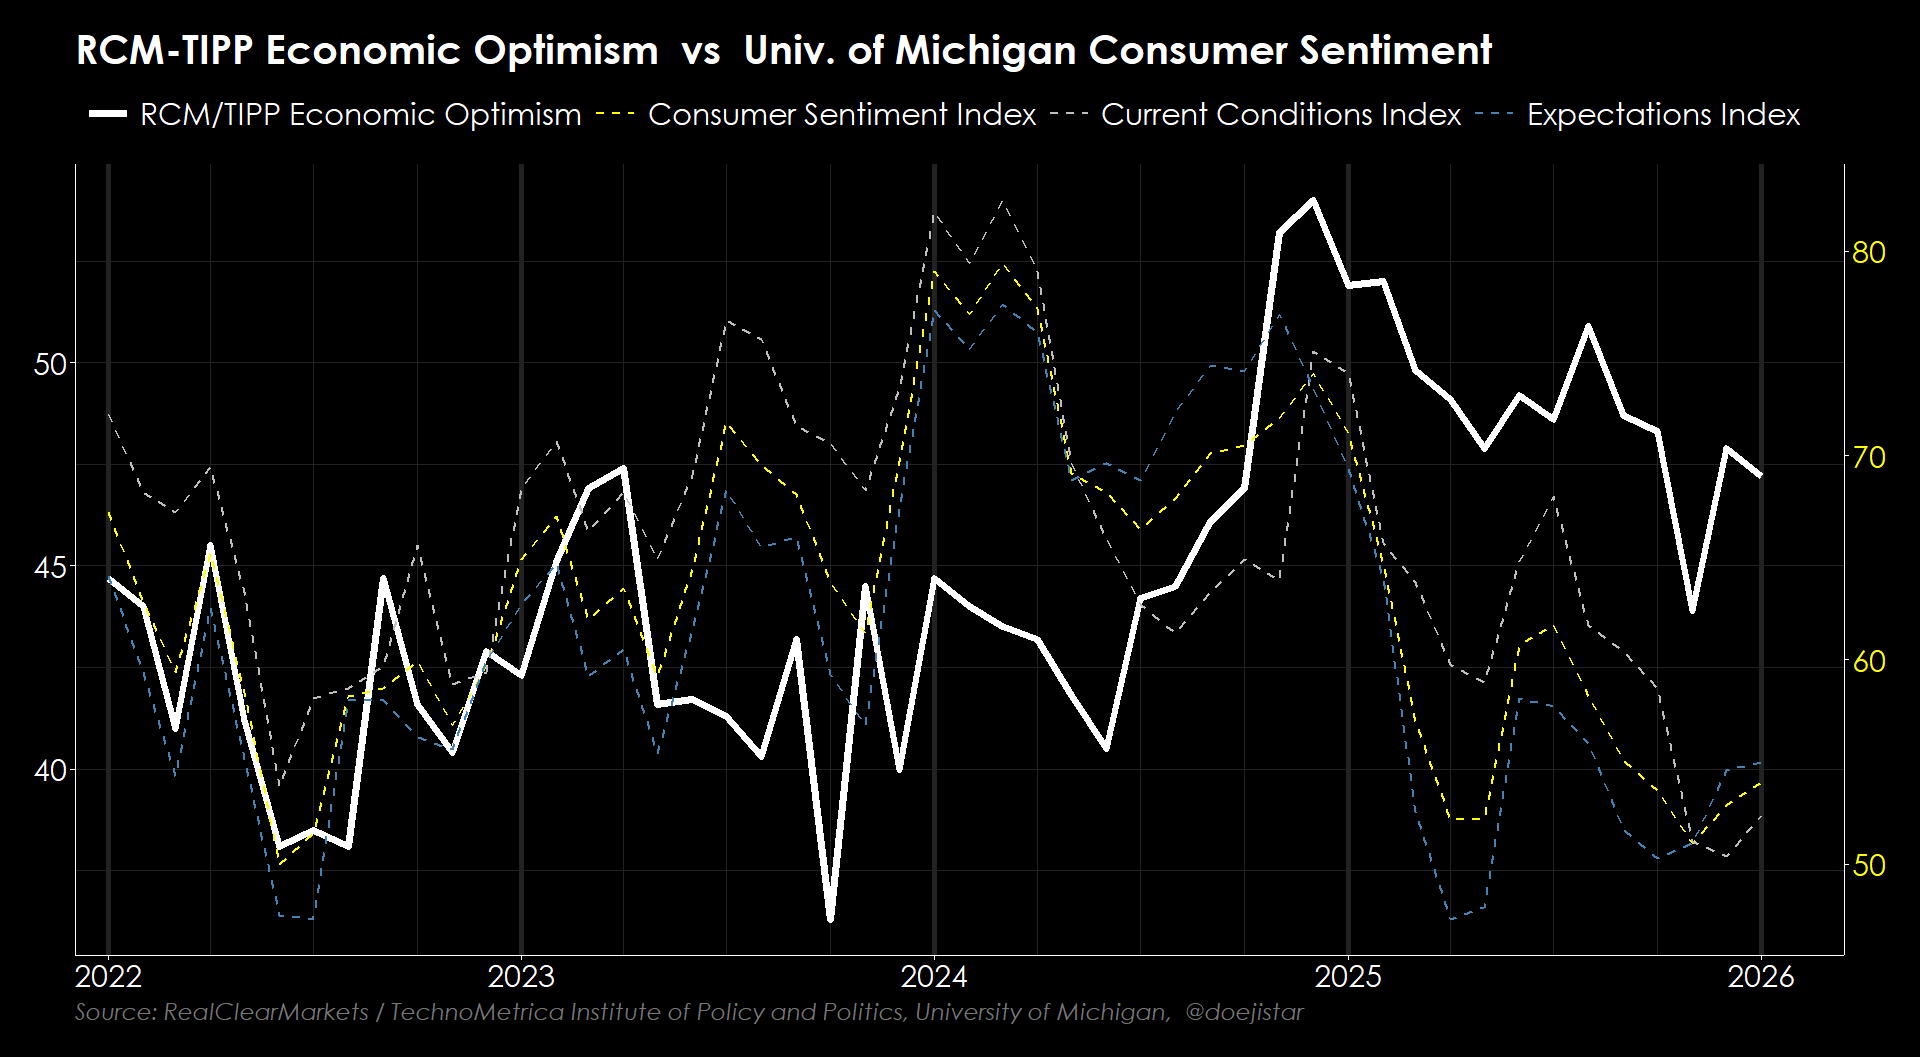
CONSUMER SENTIMENT
Consumers 6-month outlook as surveyed by RCM/TIPP receded slightly though still showing a significant improvement since the beginning of the last 4th quarter. Preliminary UoM numbers are also pointing to rebounding consumer sentiment on both current and future conditions.
FED SURVEYS
Fed's Beige Book
Growth: gradual expansion (8/12 districts reported slight to modest growth, 3 reported no change, 1 reported a modest decline), consumer spending growth being stable is the general theme though some caveat this with heavily bifurcated spending between high and low income households, and outlook deemed to be "mildly optimistic" with slight to modest growth expected in the coming months.
Labor Market: 8/12 districts reported no changes in net hiring - firms are backfilling vacancies rather than creating new roles, while reporting fewer job switchers compared to previous periods. Skill gaps persist with ongoing challenges finding skilled labour in specialised trades, and wage growth considered to have largely normalised.
Prices: Generally moderate with only 2 districts reporting 'slight growth', but tariff impacts continue to be a consistent driver of input costs and supply chain uncertainty across all 12 districts. Firms are increasingly passing tariff-related costs to consumers as older pre-tariff inventory is depleted while many note energy and insurance costs being high.
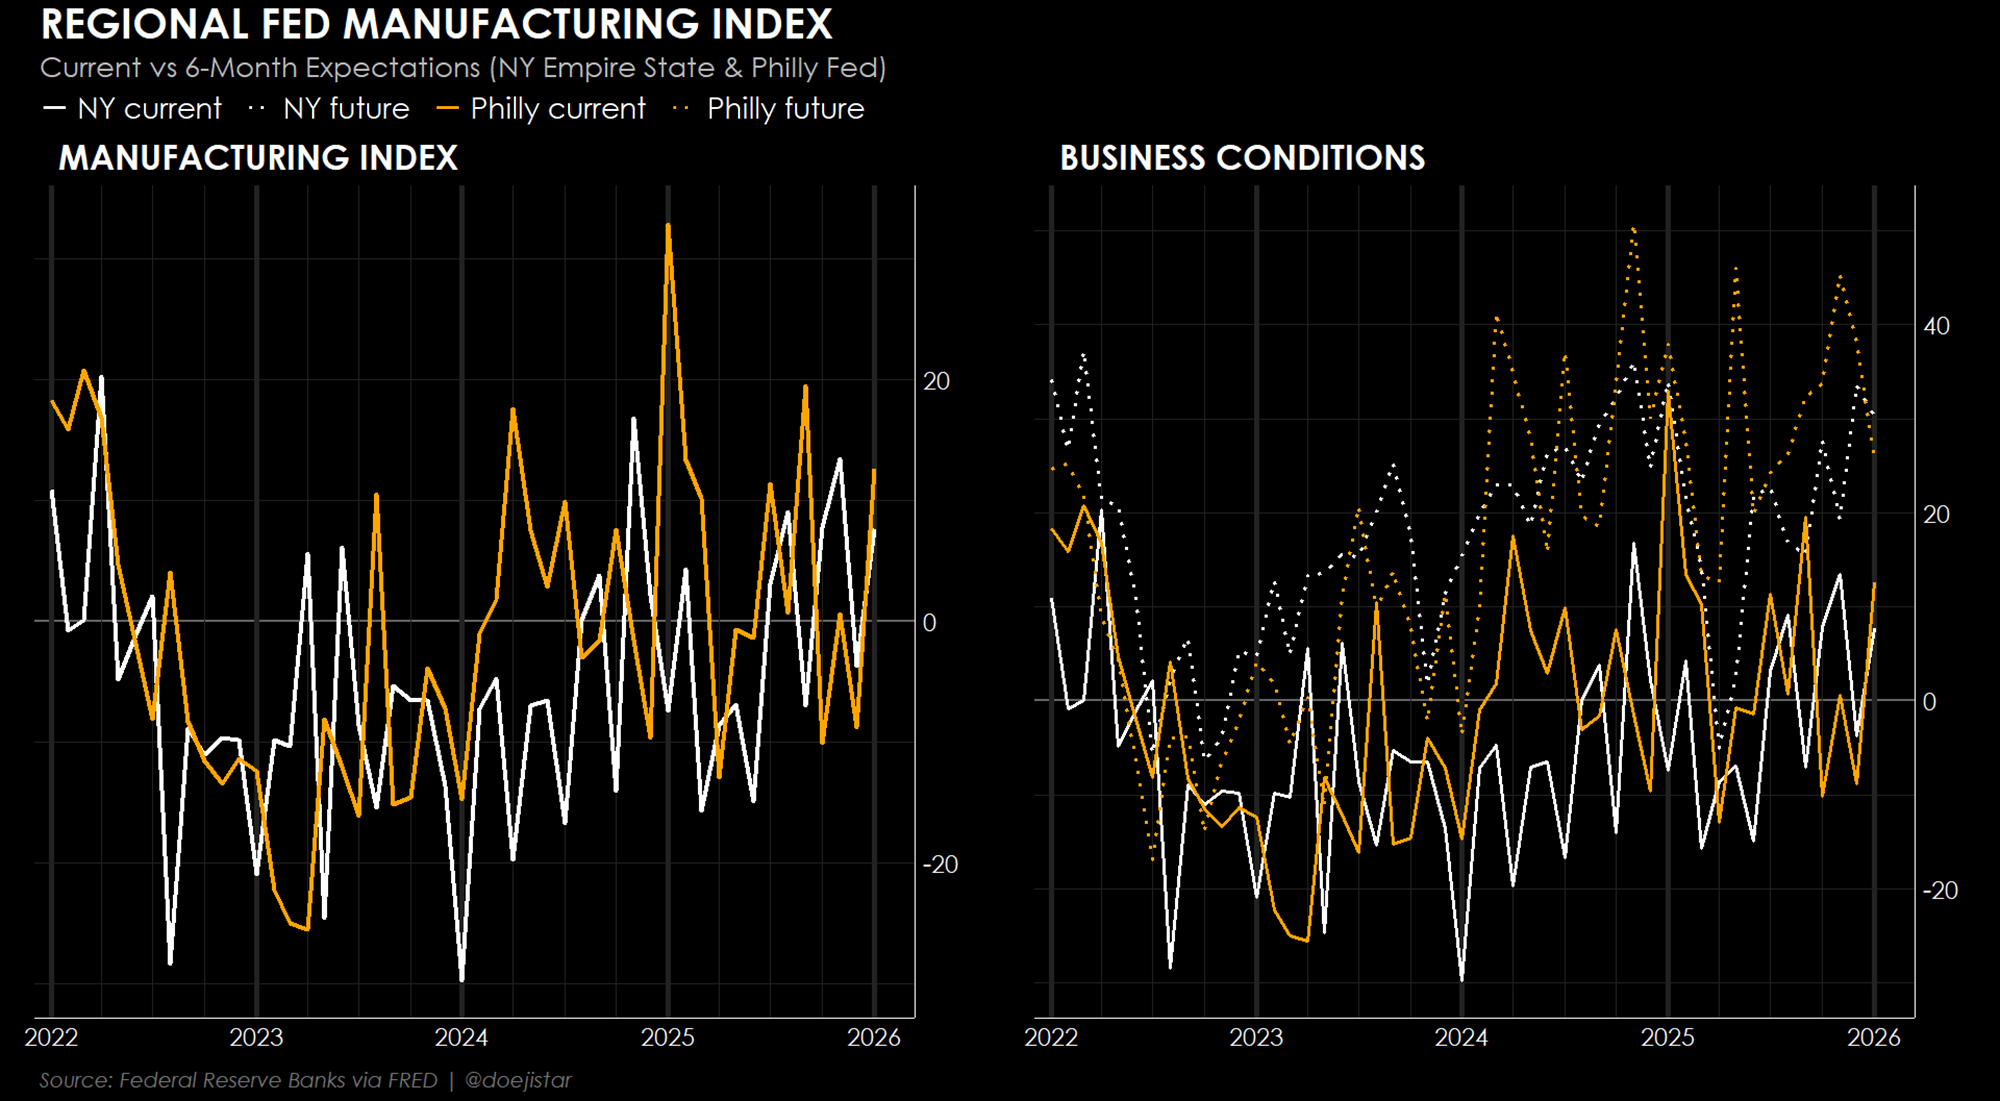
NY & Philly Fed Manufacturing
Manufacturing activity increased modestly in both New York and Philadelphia regions driven by a rebound in business conditions, though 6-month expectations have dropped in December.
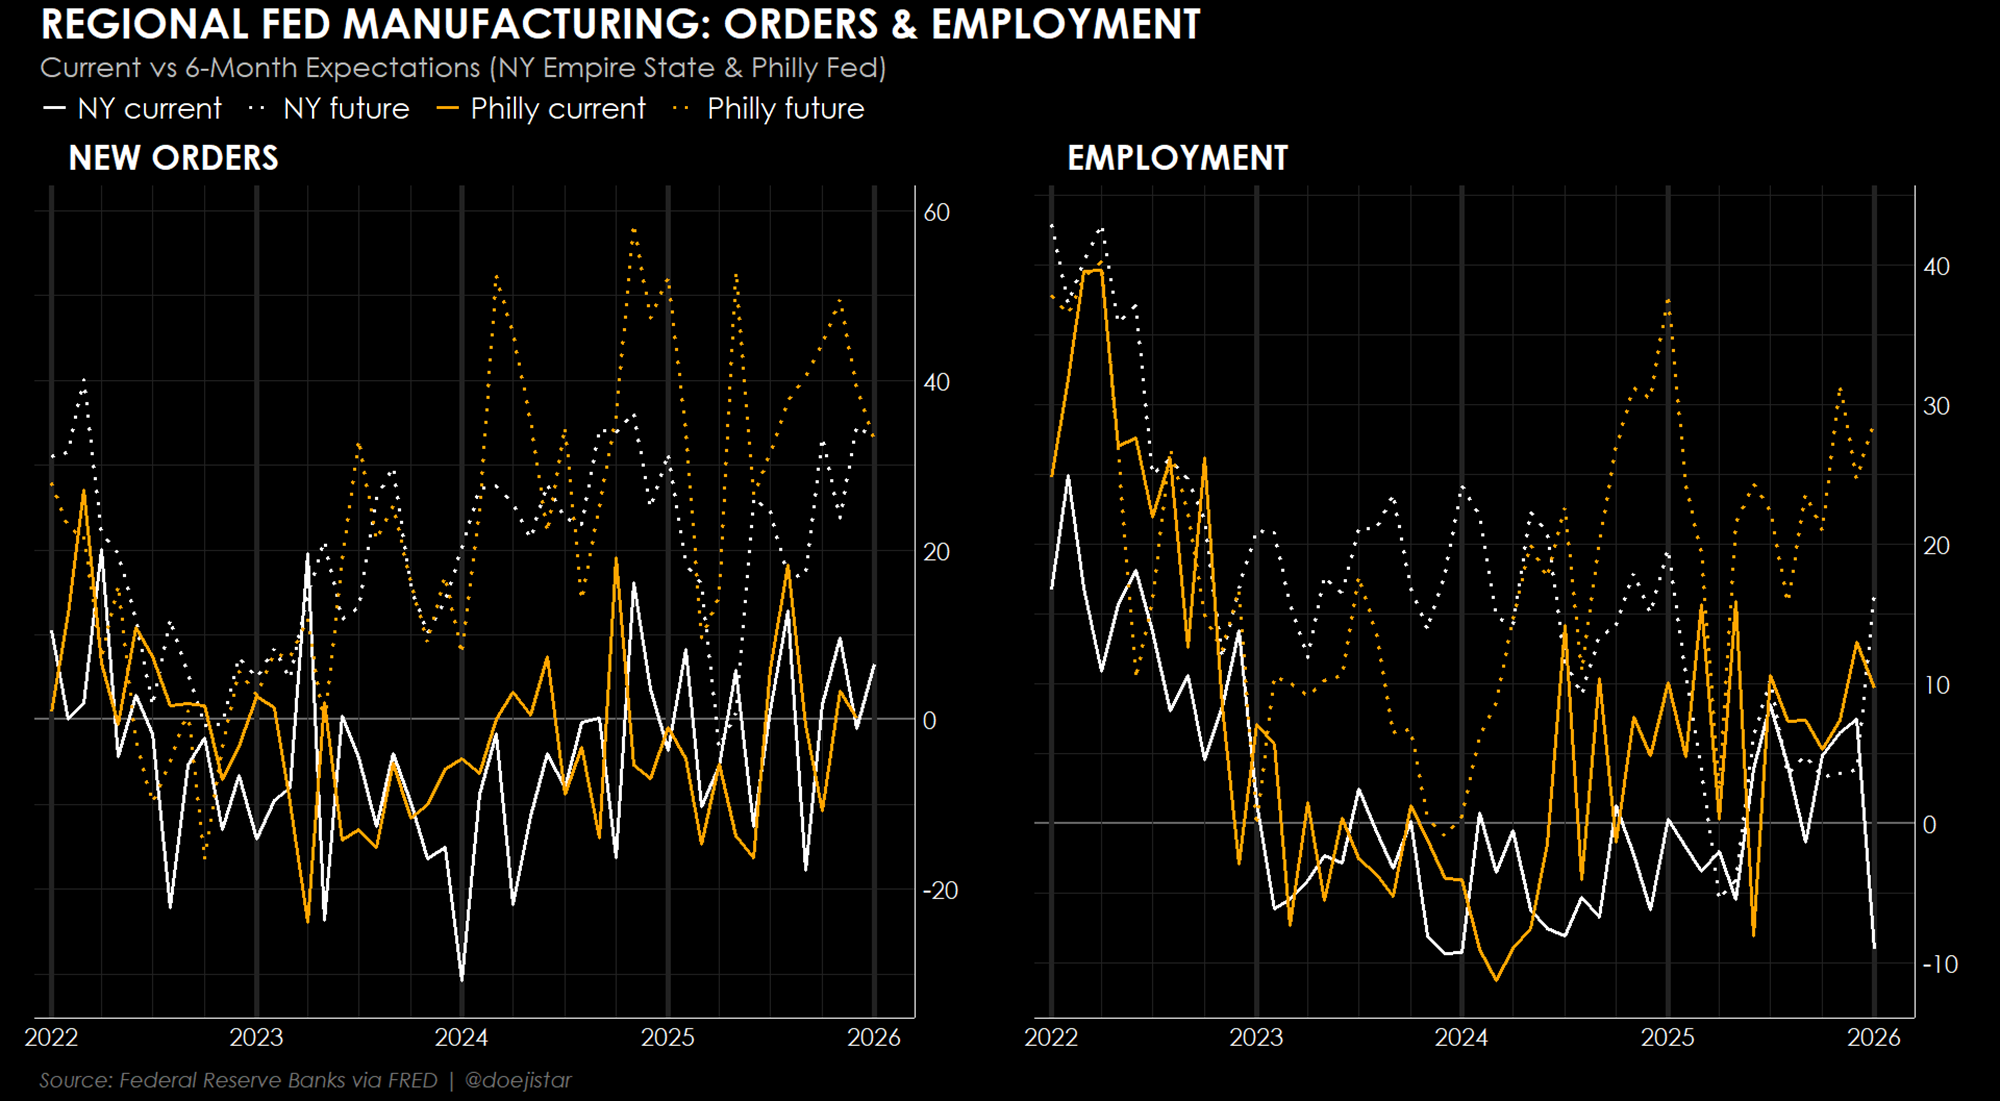
Trend in New Orders looking a bit more positive while Employment is mixed though perhaps nothing to be concerned about - expectations for future employment increased against the drop in current employment.
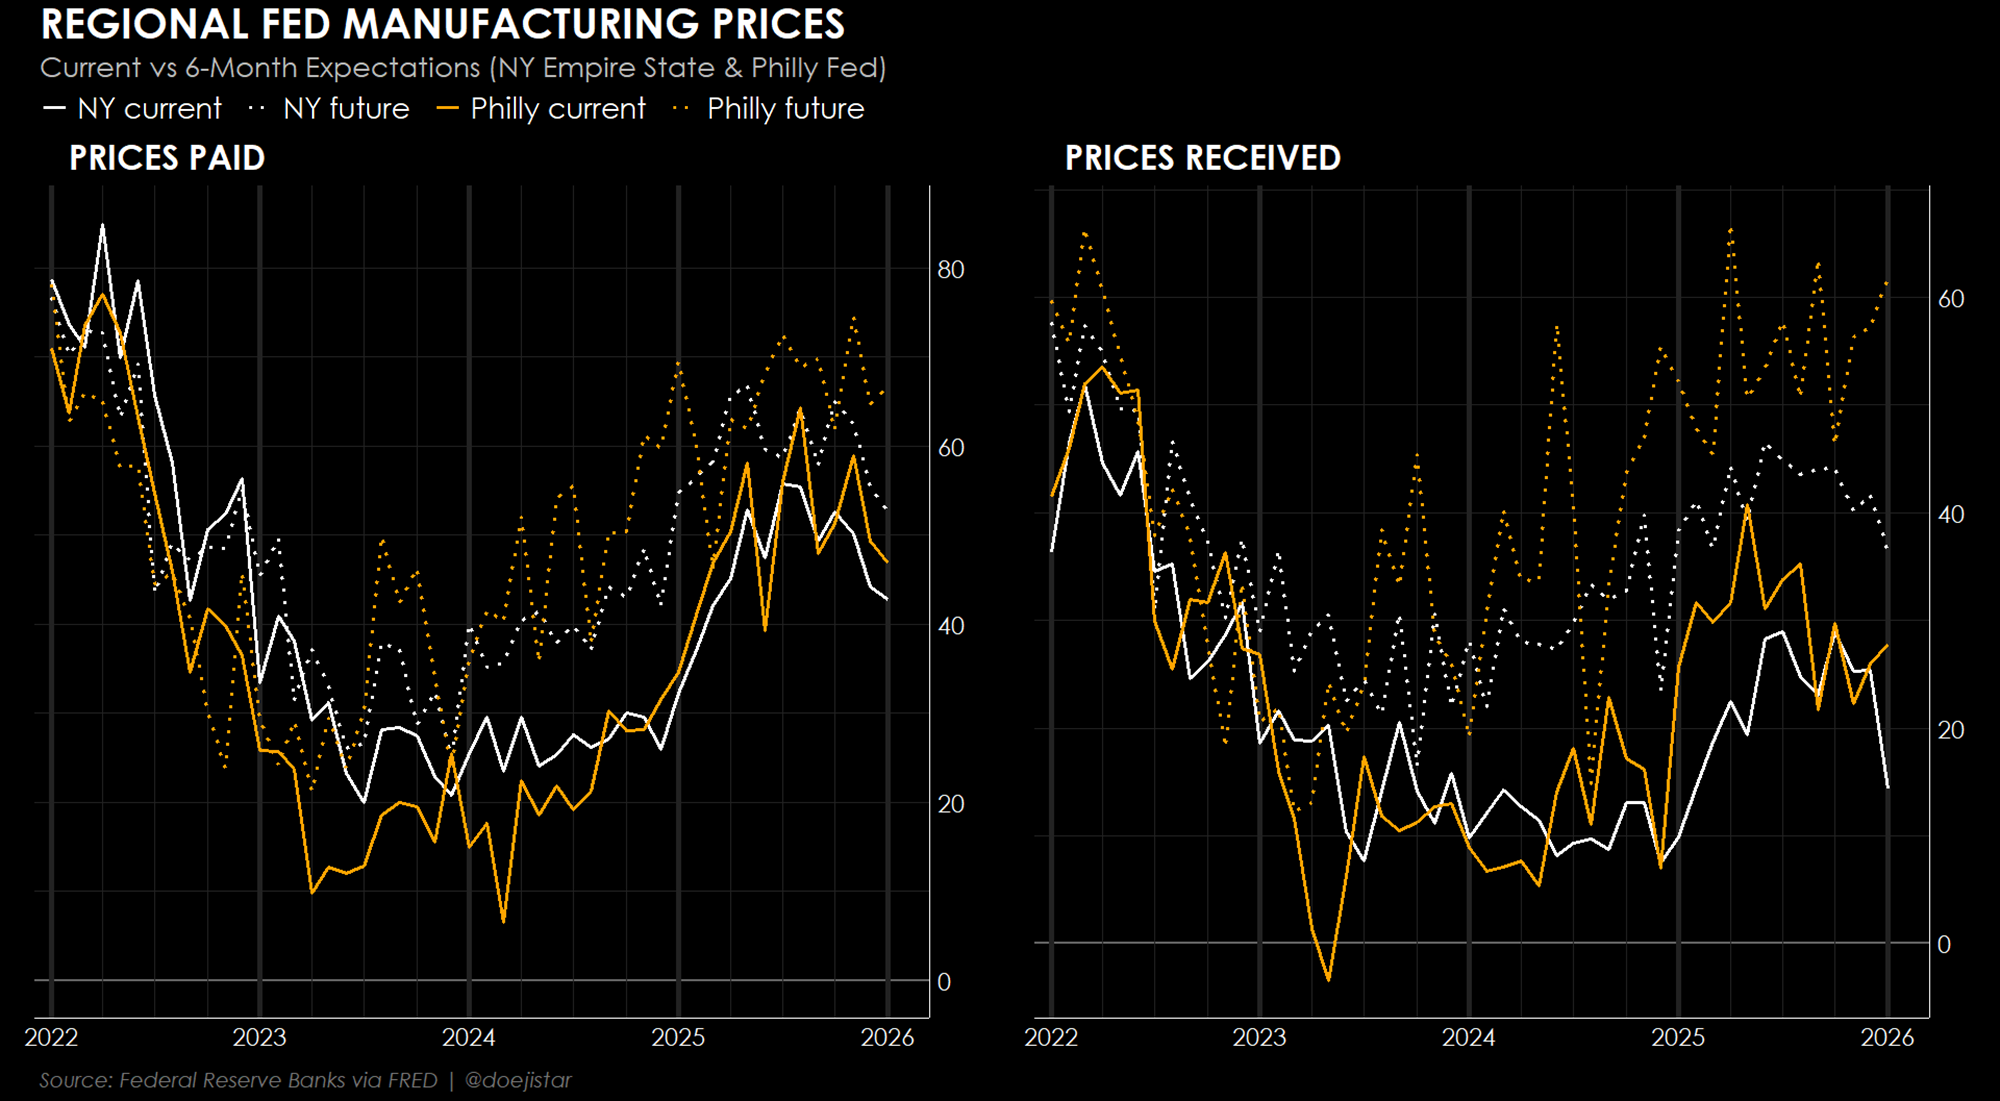
Input cost pressures as well as prices received appear to be moderating, though expectations to receive higher prices remains firm particularly for the Philly Fed survey.
On the whole, US data shows the consumer economy is stable via retail sales and consumer spending, while business surveys are pointing modest expansion for small businesses and manufacturing sectors. On top of those positives, CPI and PPI reports shows a persistence of sticky inflation, supporting the FOMC's general 'wait-and-see' stance of being in 'no-rush' to cut.
NEW ZEALAND DATA
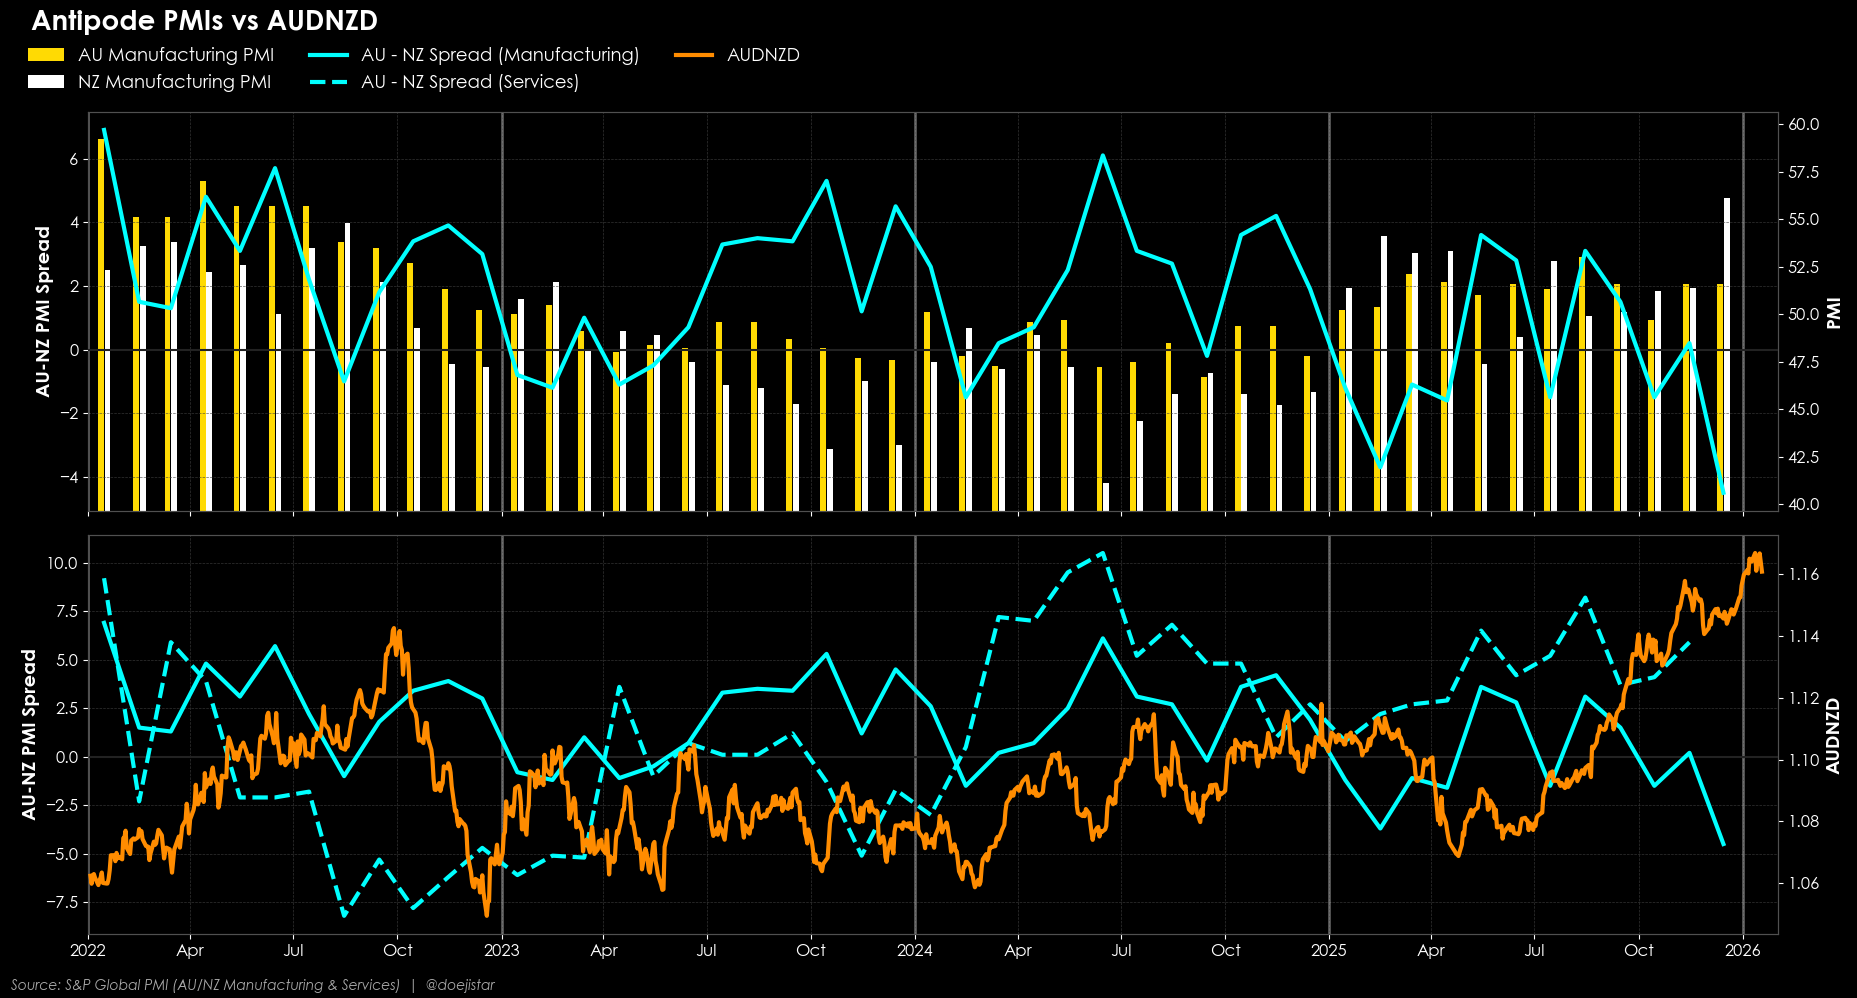
One major focus in the MTT group has been the New Zealand economy in relative value terms; specifically whether the data continues to provide evidence of an economic recovery getting underway to the extent that we can favour NZD longs over other commodity/risk currency peers.
The December NZ manufacturing PMI printed its strongest reading in 4 years, 4.5 points higher than expected at 56.1 and 4.7 points higher than the prior month's 51.4 print. This certainly helps to bolster the case that the pickup in Q3 GDP can be sustained.
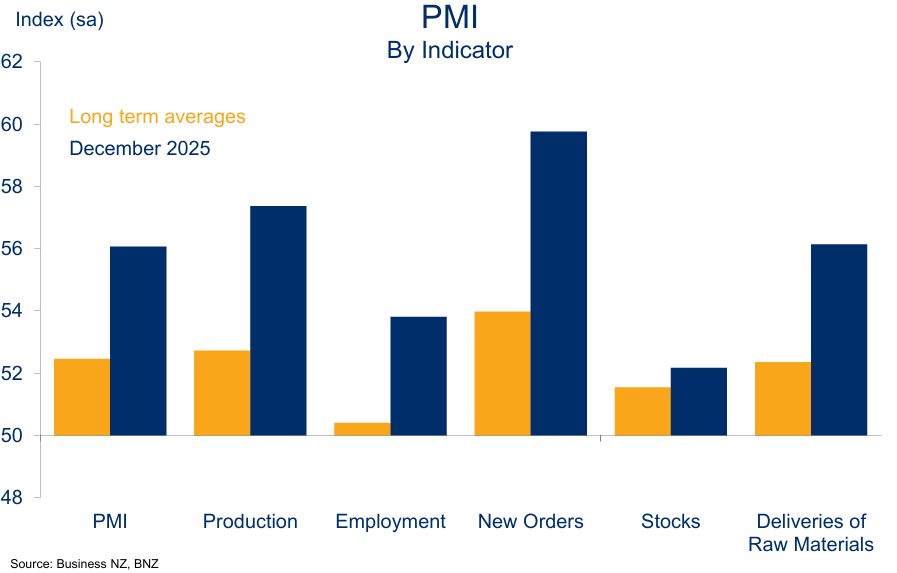
Readings were strong well above longer term averages across the board, but Services on the other hand will need to see a big pickup to be wholeheartedly positive on the NZ economy. It has been in contraction for a good part of the last 2 years (contraction readings for 25 of the last 30 months) with the last reading at 46.9 for November, and we look forward to the December reading on Tuesday to weigh in on our already increasing conviction of some NZD outperformance.
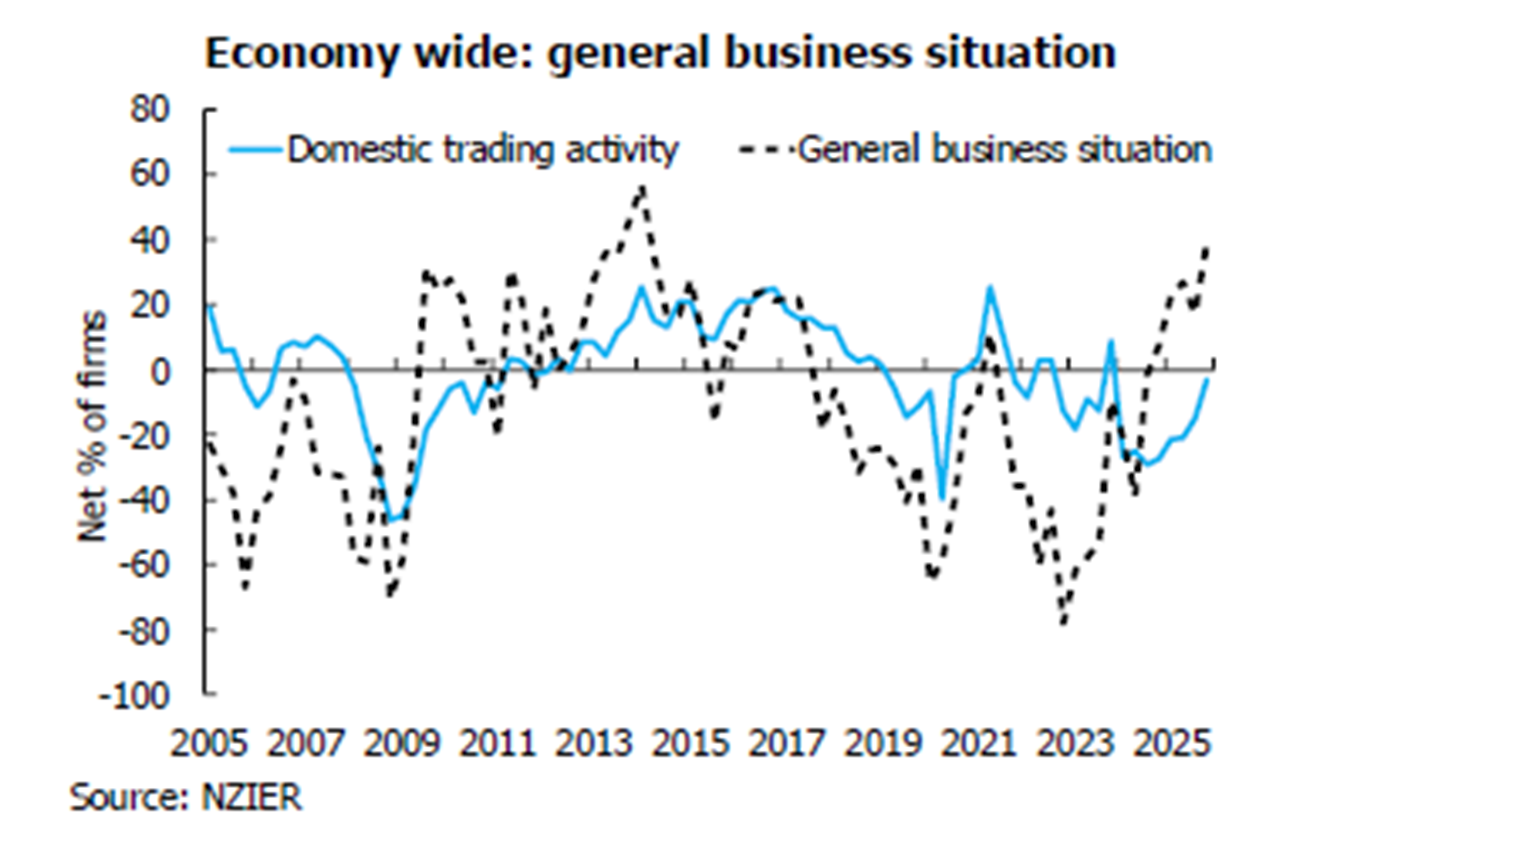
NZIER Business Confidence also showed a strong lift in business confidence during the final quarter of 2025. A net 39% of firms expect better economic conditions over the coming months - the highest since March 2014 and a substantial increase from the net 17% recorded for the Q3 period. NZIER reports that confidence rebounded across all sectors with manufacturing in particular now the 'most' optimistic sector, which contrasts from it being the 'least' optimistic sector in the prior quarter.
NZIER also sees the RBNZ's next move being a hike:
"This lift in manufacturers’ confidence appears to be supported by increased domestic and export demand. Although costs remained high, manufacturers reported improved profitability for the quarter. With demand starting to recover but inflation remaining contained, we forecast the OCR to trough at 2.25 percent until the RBNZ commences increasing the OCR in the second half of 2026."
LOOKING AHEAD
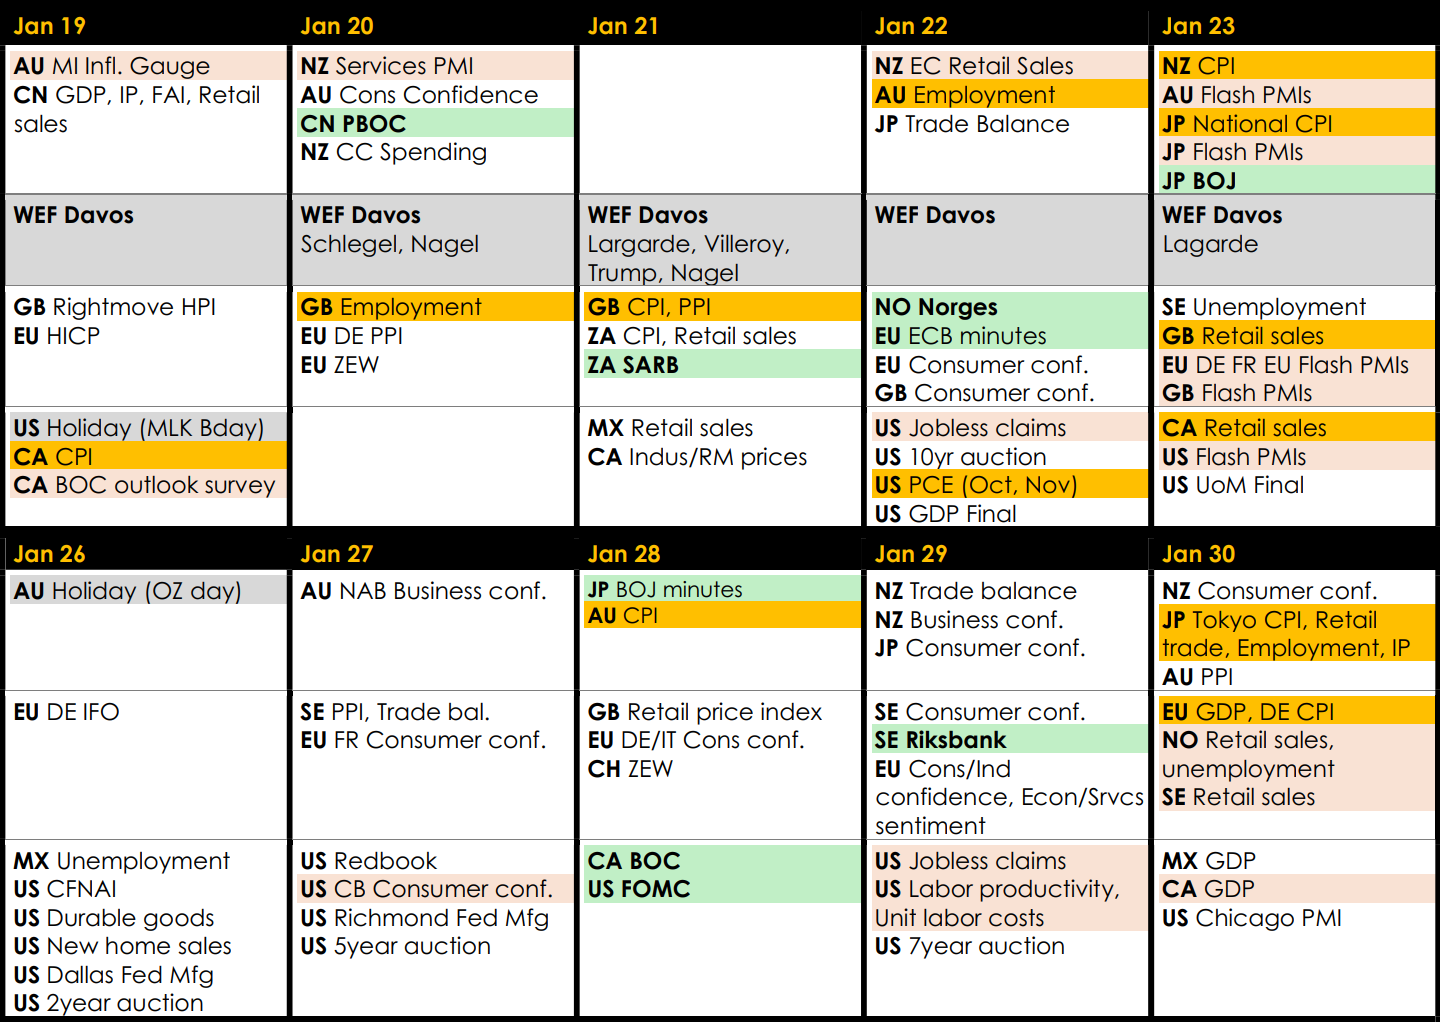
- Australia's fundamentals have been strong, but there is a growing expectation that the RBA could soon begin hiking again which could hit consumer confidence and employment activity. From New Zealand, we also see some consumer spending data in addition to the Services PMI to gauge whether the ongoing recovery has breadth beyond the manufacturing sector.
- Big focus on UK with its increasingly gloomy outlook for which, I'm probably the most negative on among the G10 economies, along with Canada. We get a trio of employment, inflation, and retail sales data from the UK this week.
- Several central bank decisions this week with the BOJ likely to get the most attention. We continue to hear commentary the BOJ could/should be hiking faster than they have made out, even a hike as early as this or the next meeting. As I have reiterated for quite some time - in my weeklies, as well as on X and group chats, I doubt that the BOJ will be any faster than the market expects. The BOJ will get early indications over the coming month or so of how the spring wage negotiations is shaping up, and of which Ueda has stated that this is something they want to assess before any further policy decisions. Even so, inflation is expected to ease helped by base effects, and I think it's fairly unlikely that we will see a hike in the 1st half of this year.
Technicals
EQUITIES
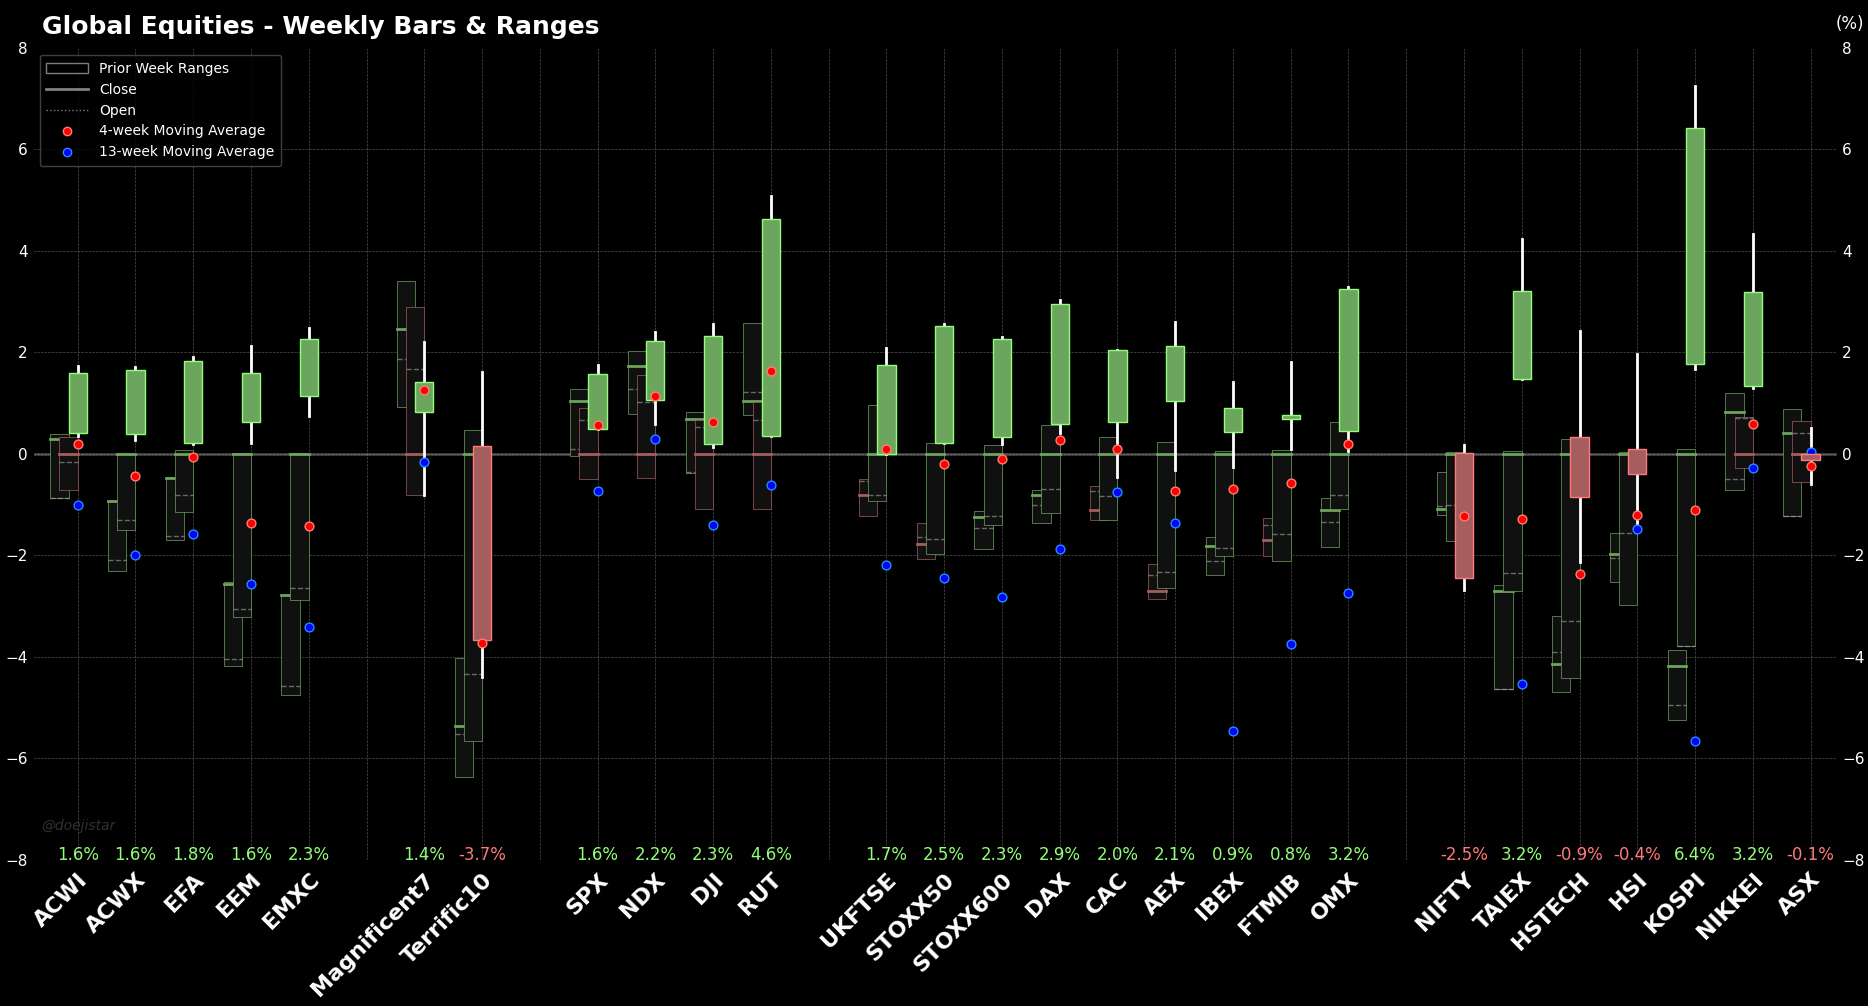
Exceptionally strong rallies across the board with just a few exceptions. Kospi and Russell the standout performers last week followed by Nikkei and Taiex.
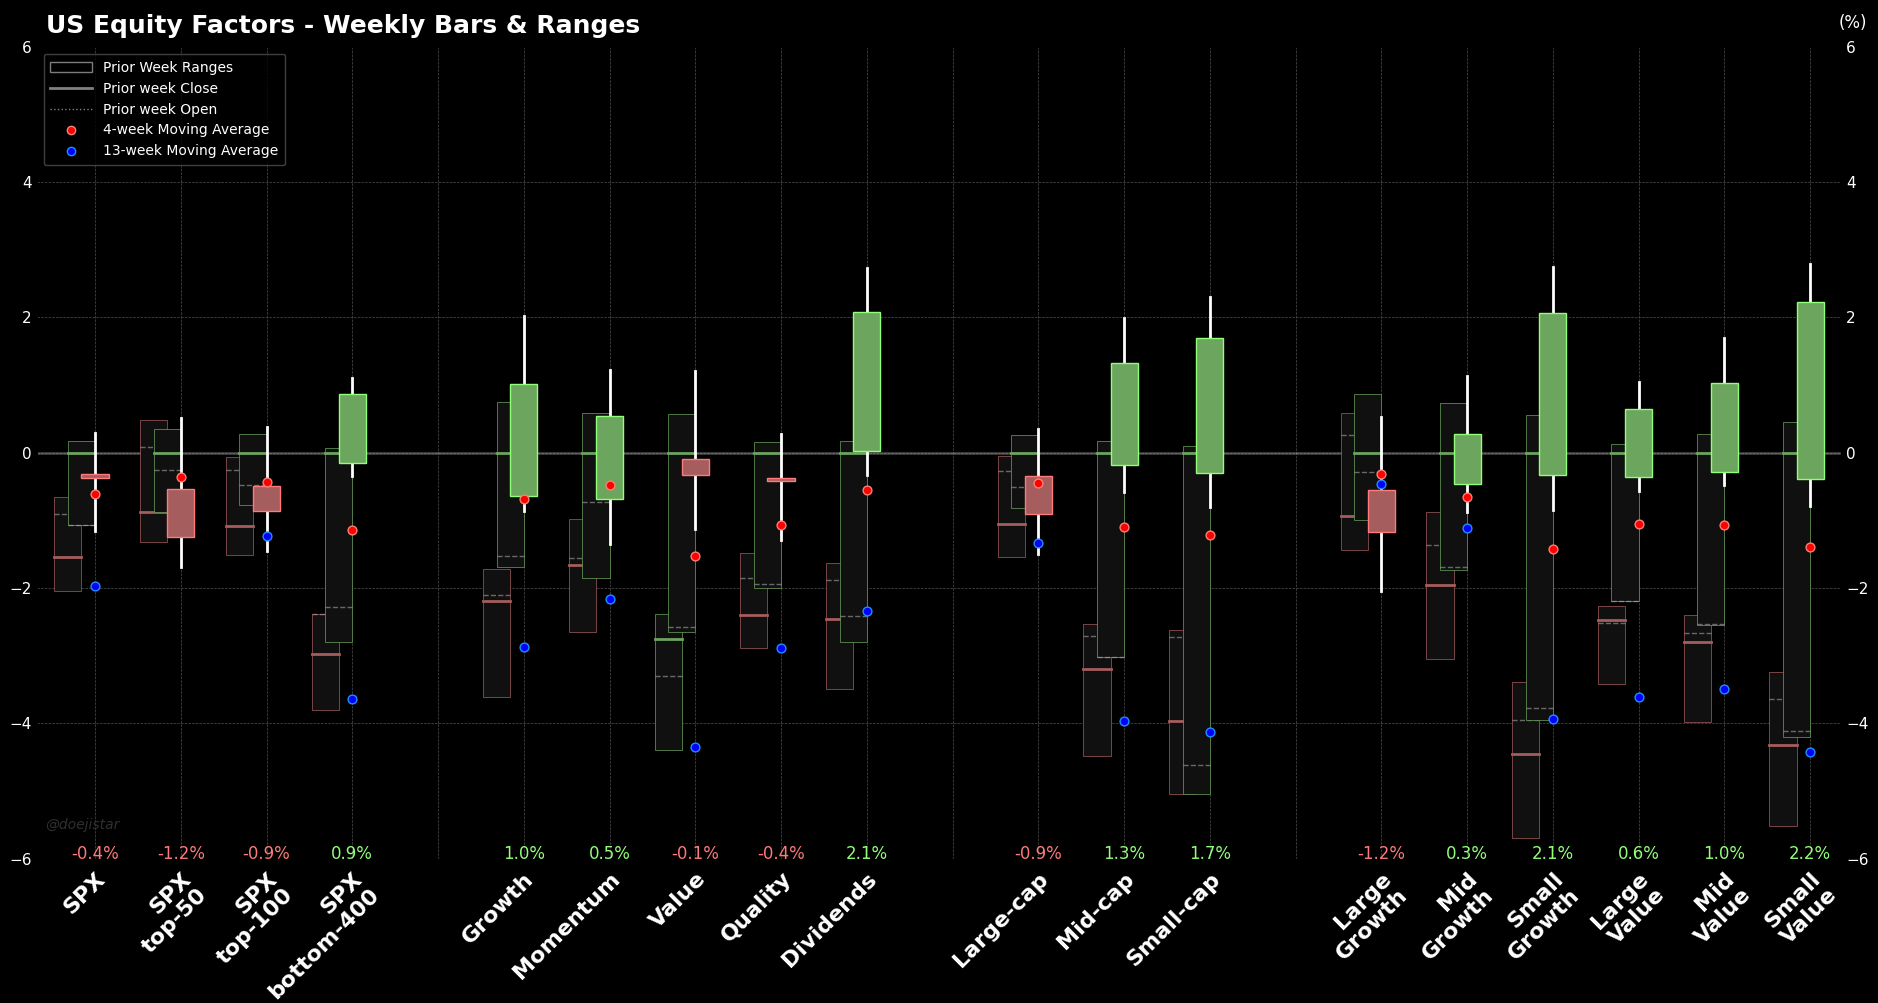
Broadening remains the theme in US equities. Bottom-400 and SMid-caps outperform the heavyweights with a leaning towards value and dividend factors.
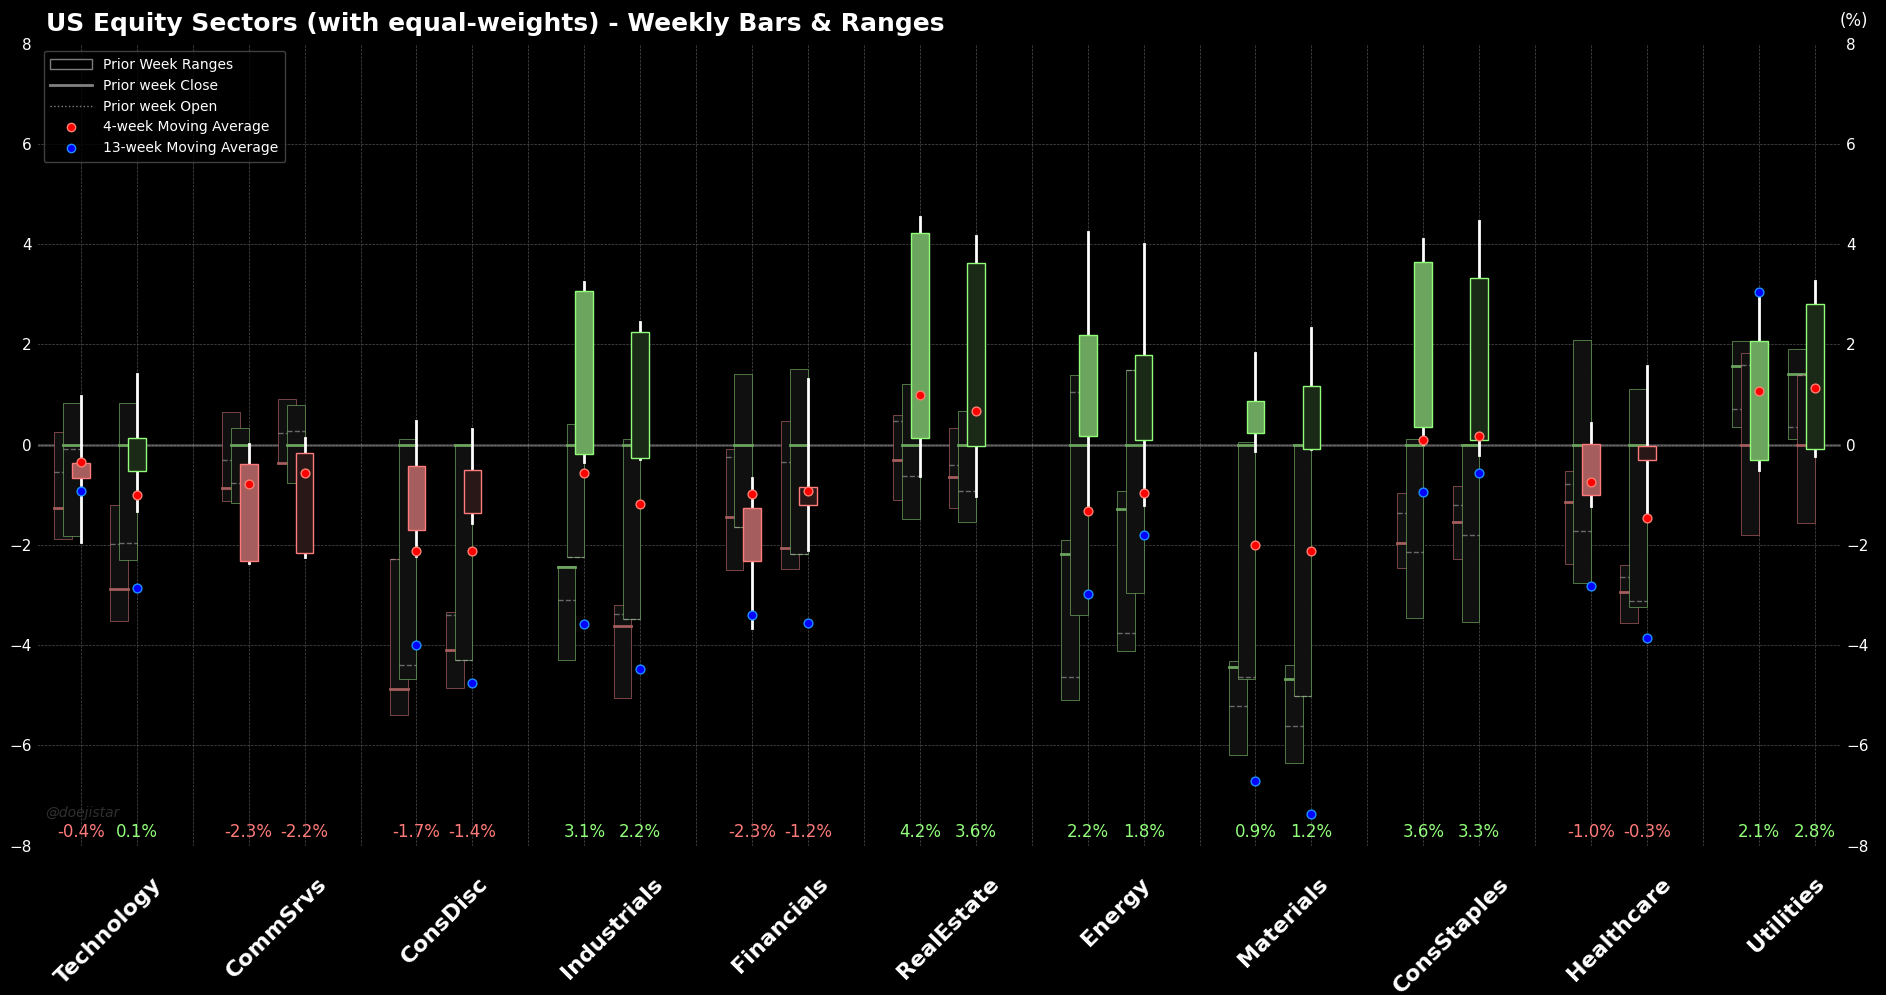
Communication services the worst performing sector followed by Discretionary. Industrials performed well along with other Defensive sectors.
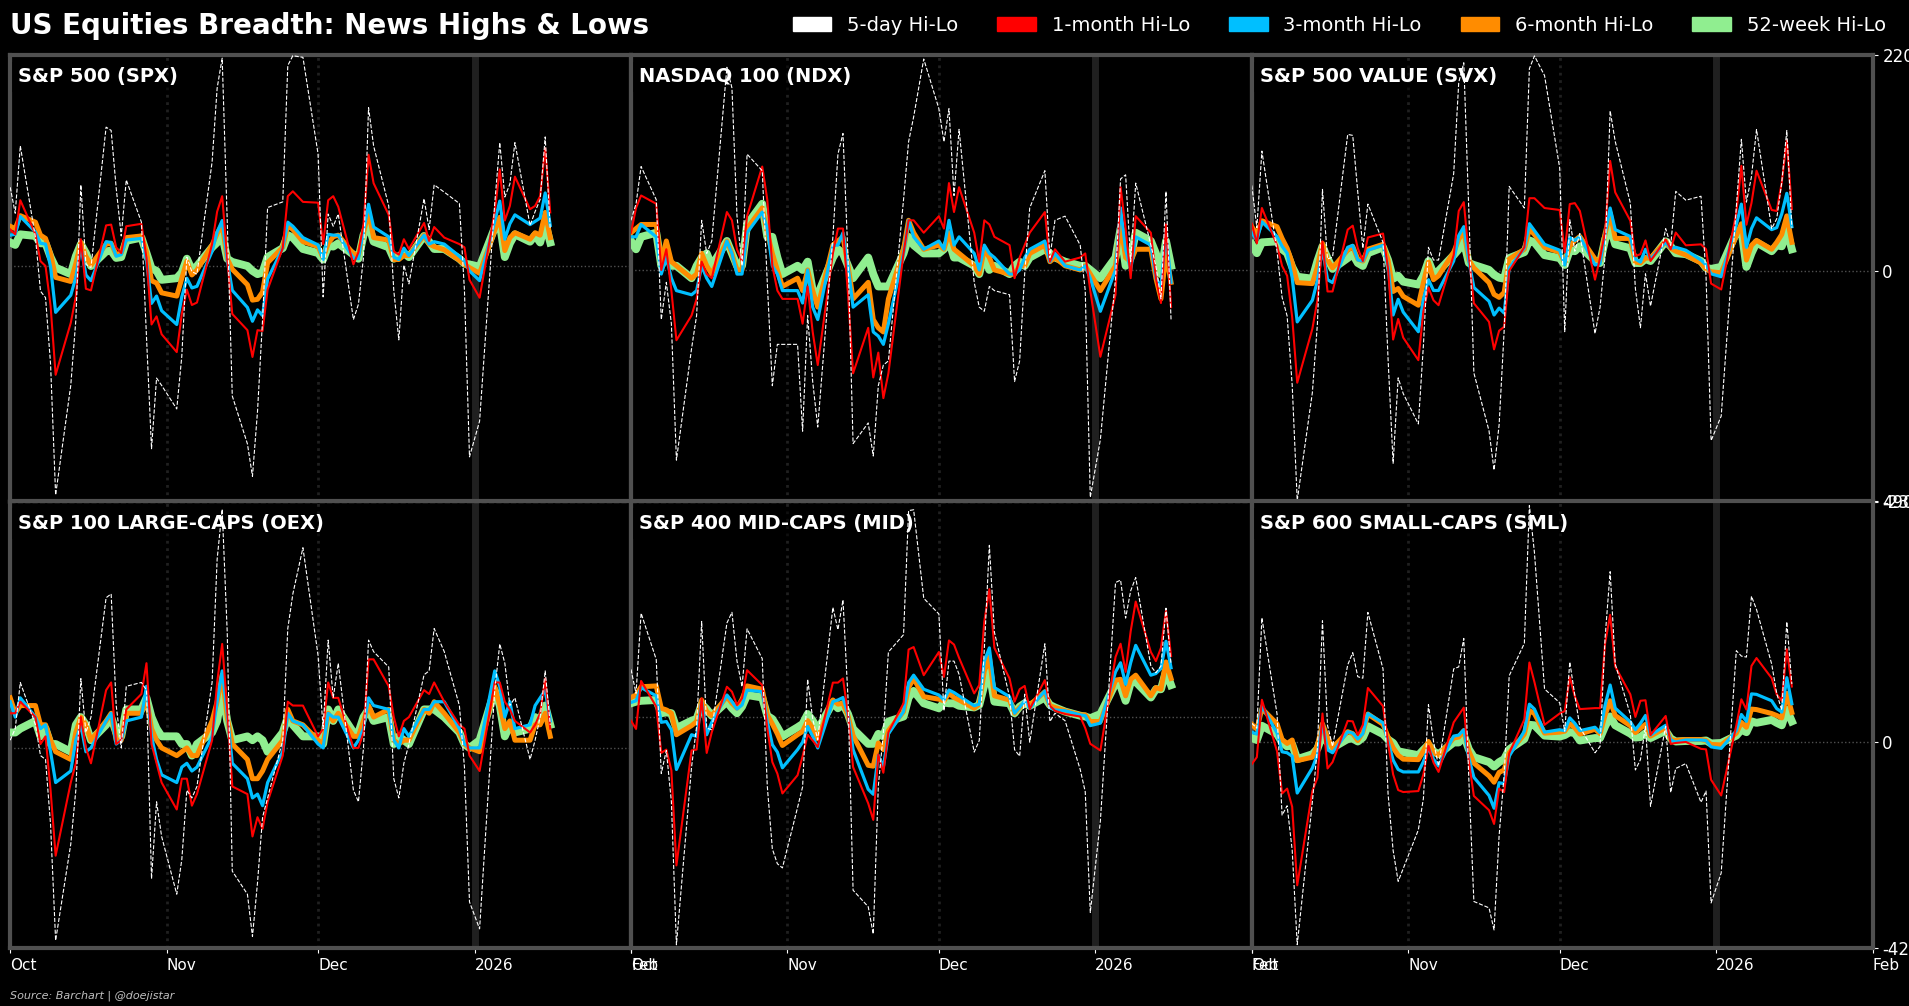
The net number of stocks making new highs is showing slightly divergent trends as the S&P500, Dow, and Russell all printed new record highs last week.
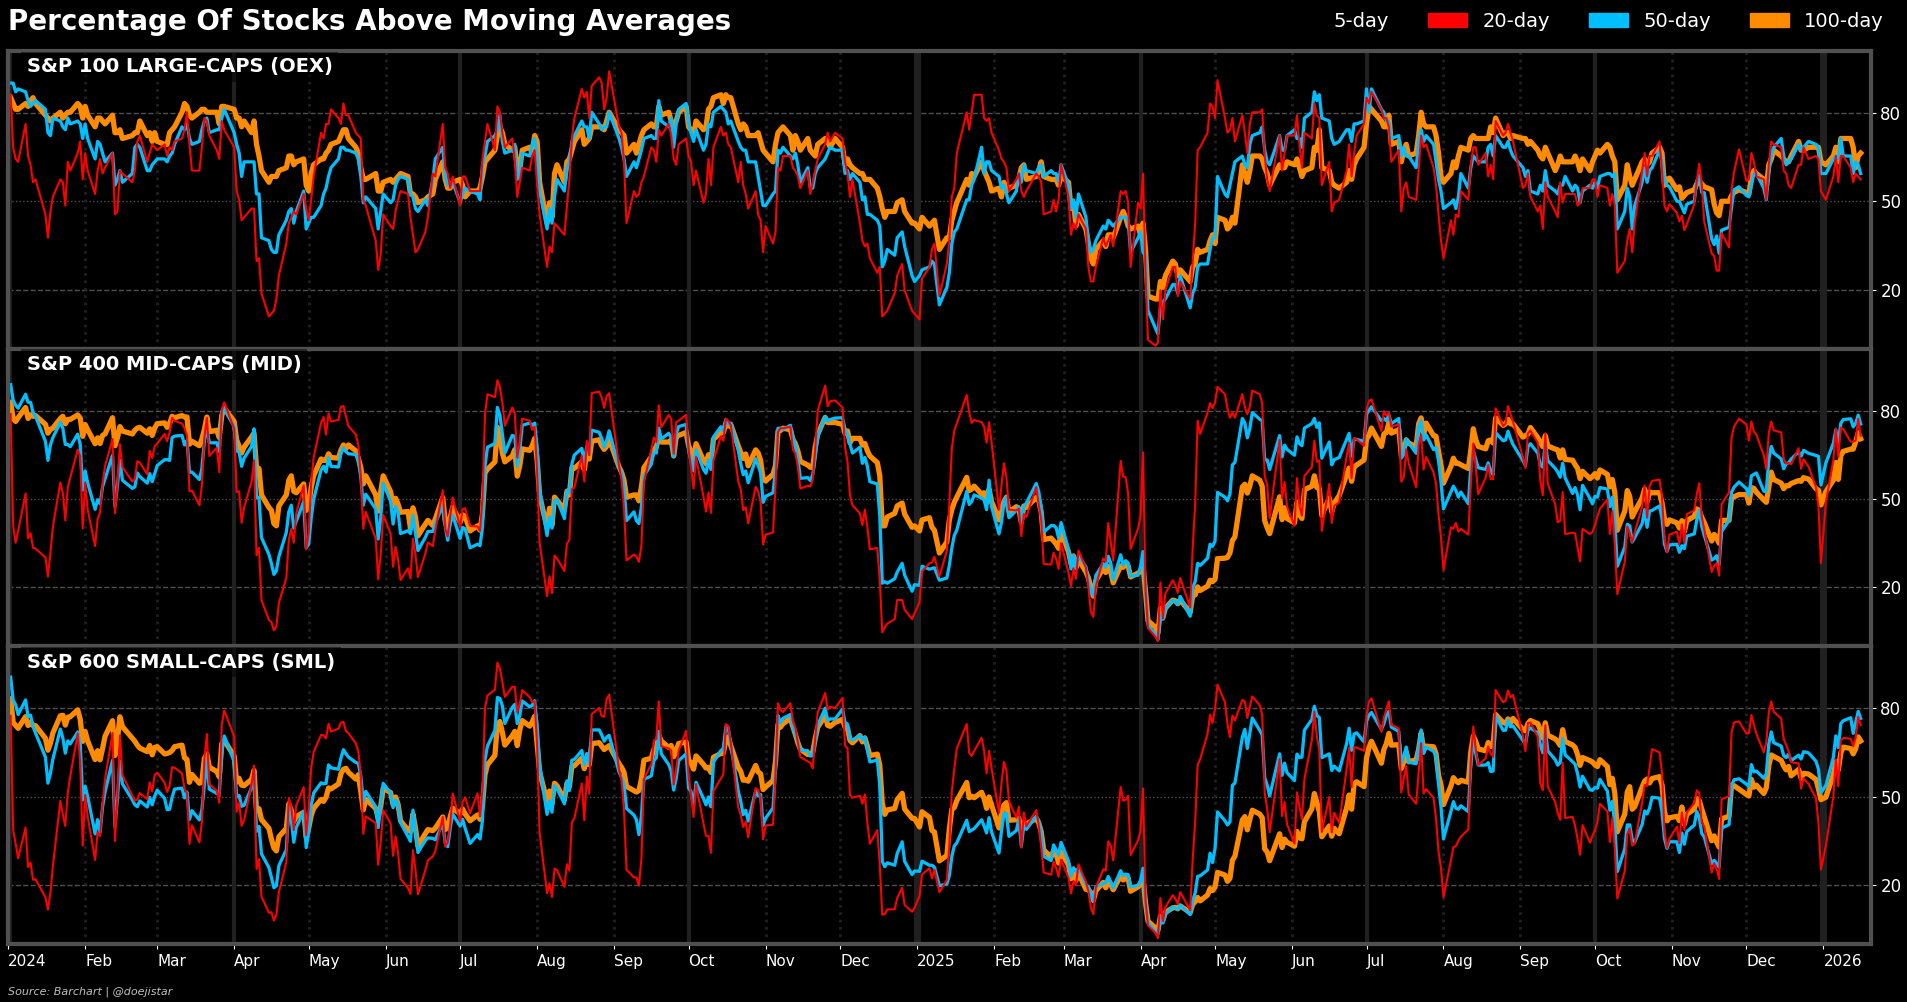
A strong majority of Mid & Small-cap stocks are trading above their 20, 50 and 100 day moving averages and are typically at risk of unwinding when approaching these levels; particularly when the 50-day series (blue) reaches the 80% threshold.
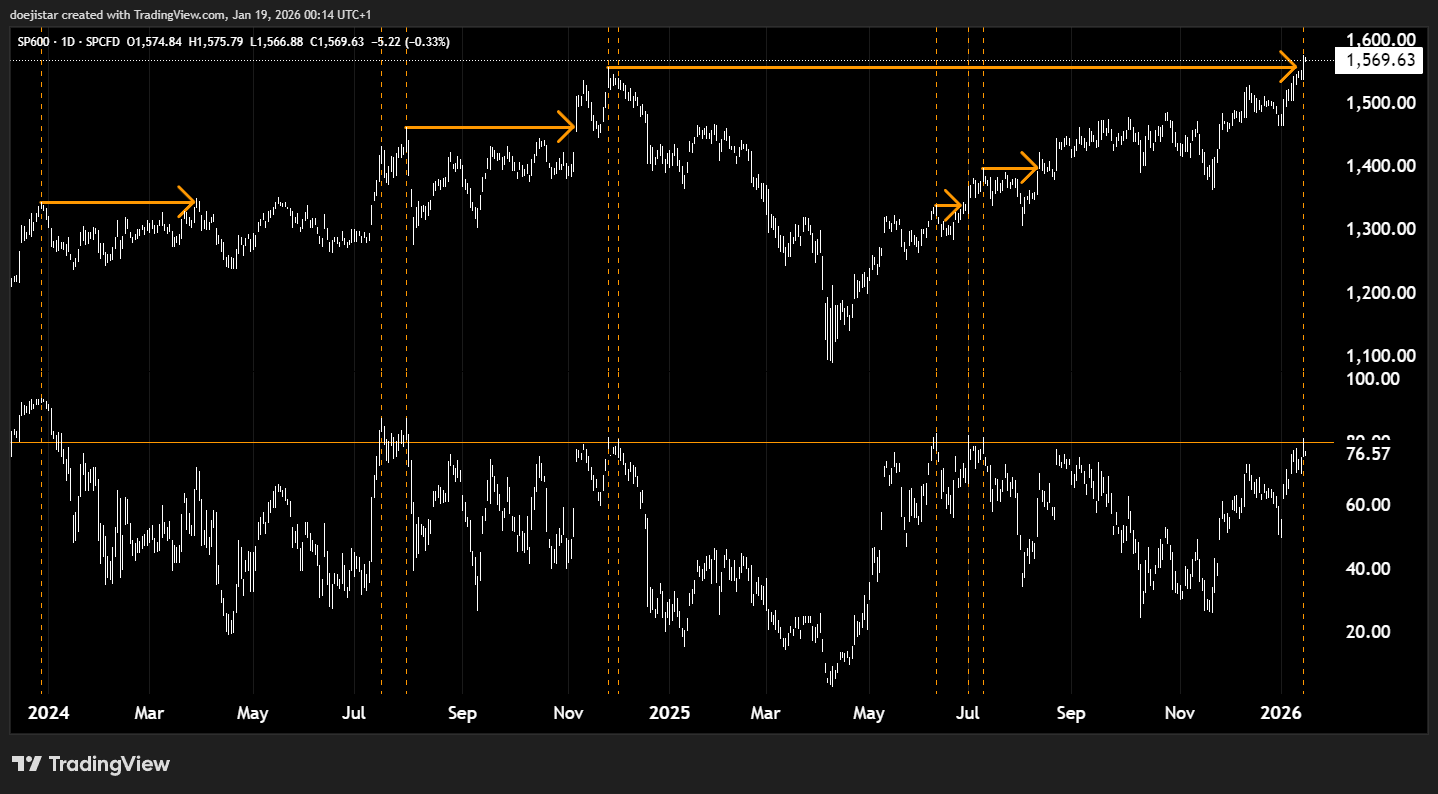
For example, the high in last July wasn't exceeded for another month when reaching similar levels; earlier in May we saw a slight pullback without a higher high in over 2 weeks, and before the November rally of 2024 high was not exceeded until just last week - over a year.
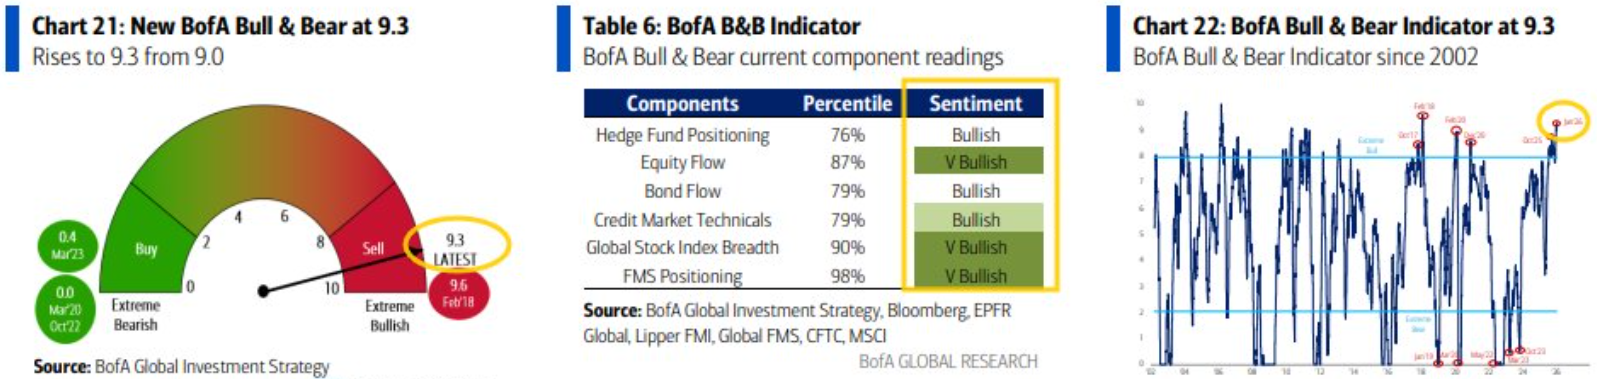
BofA's Bull & Bear rose further into extreme Bullish territory last week.
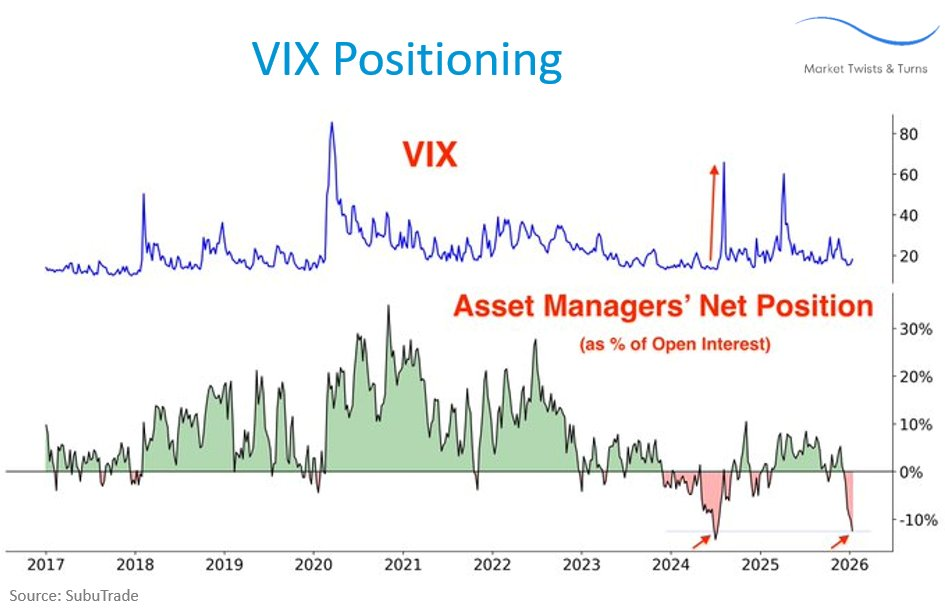
And we continue to see posts of the crowded short-vol trade.
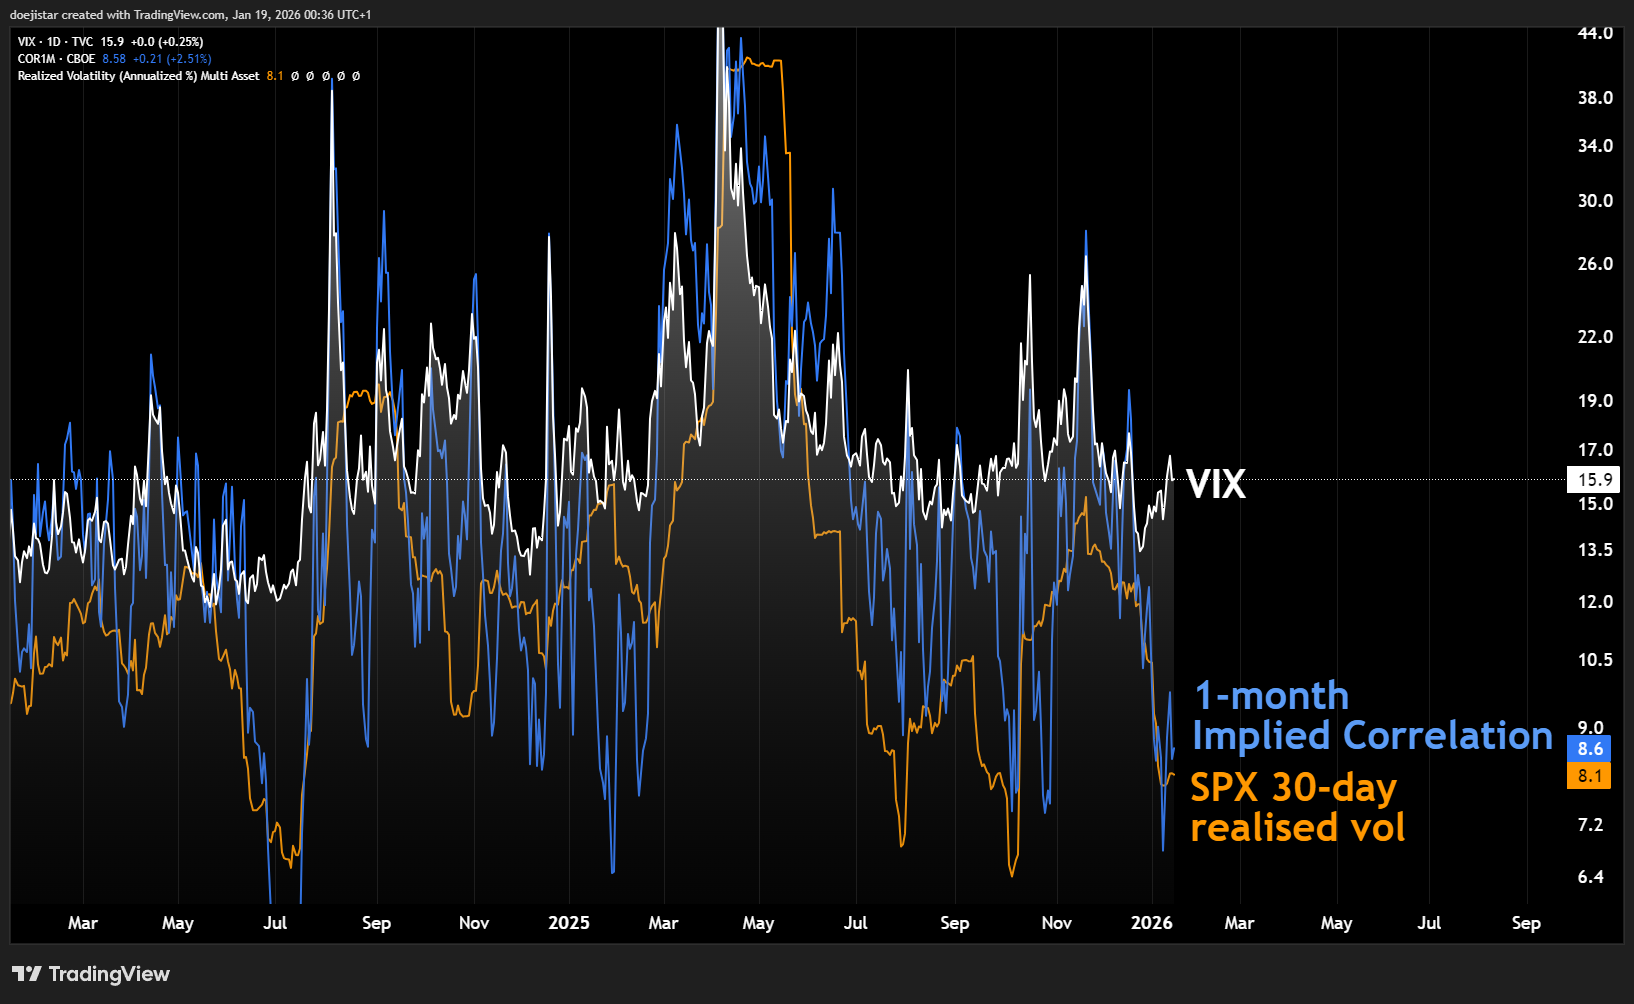
1-month implied correlation being at low extremes also suggests the vol-dispersion trade is fairly crowded, and we are starting to see vol pick up ever so slightly over the past week. SPX closed the week slightly down -0.38% with a long indecision bar with a larger weekly range than the previous week. The Daily chart is showing a wedge-like structure and looking technically vulnerable to further consolidation to the downside than a grind higher.
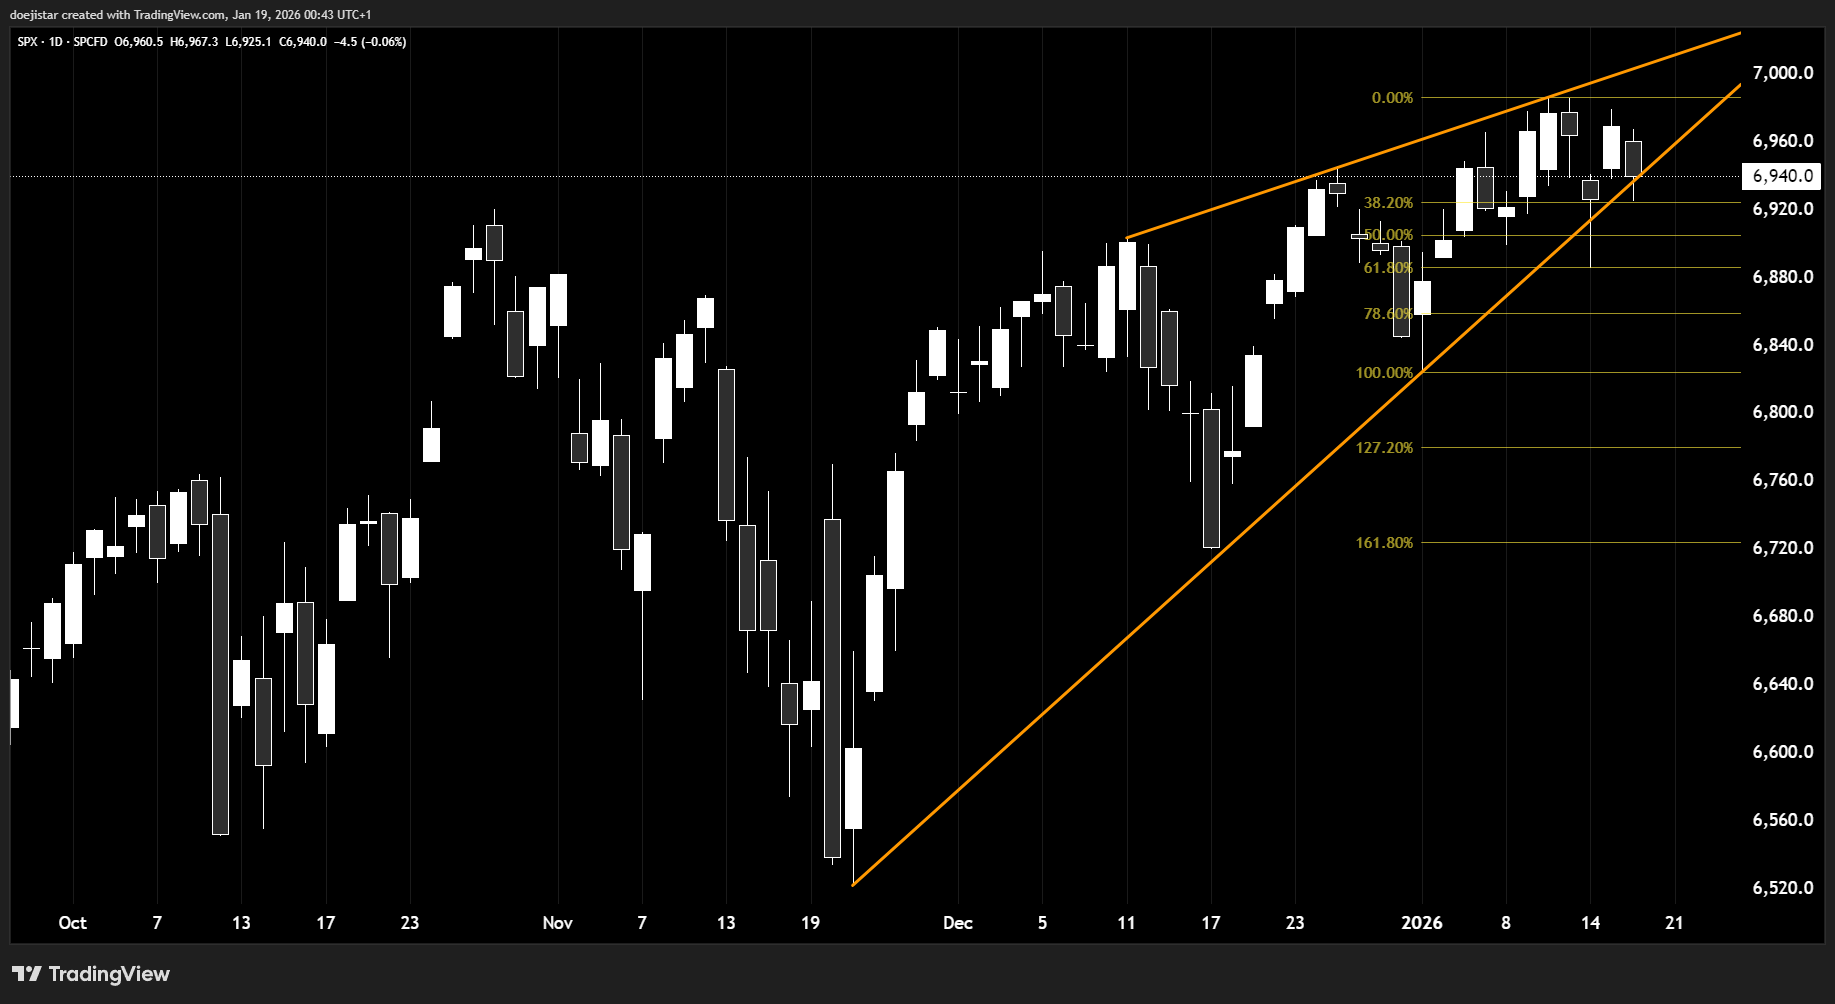
This time last week, I noted that I was "staying somewhat constructive as the strong uptrend needs to be respected", but given some fragility in the price action beginning to come through, I've begun tilting towards the short risk side last week with some reasons I covered at the top of this note.
COMMODITIES
This silver rally is truly a sight to behold, tripling in price within a space of a year. This is a historical level of 'stretched', only exceeded by the Silver-Thursday event back at the beginning of 1980 in magnitude from the 50, 100 and 200wma's.
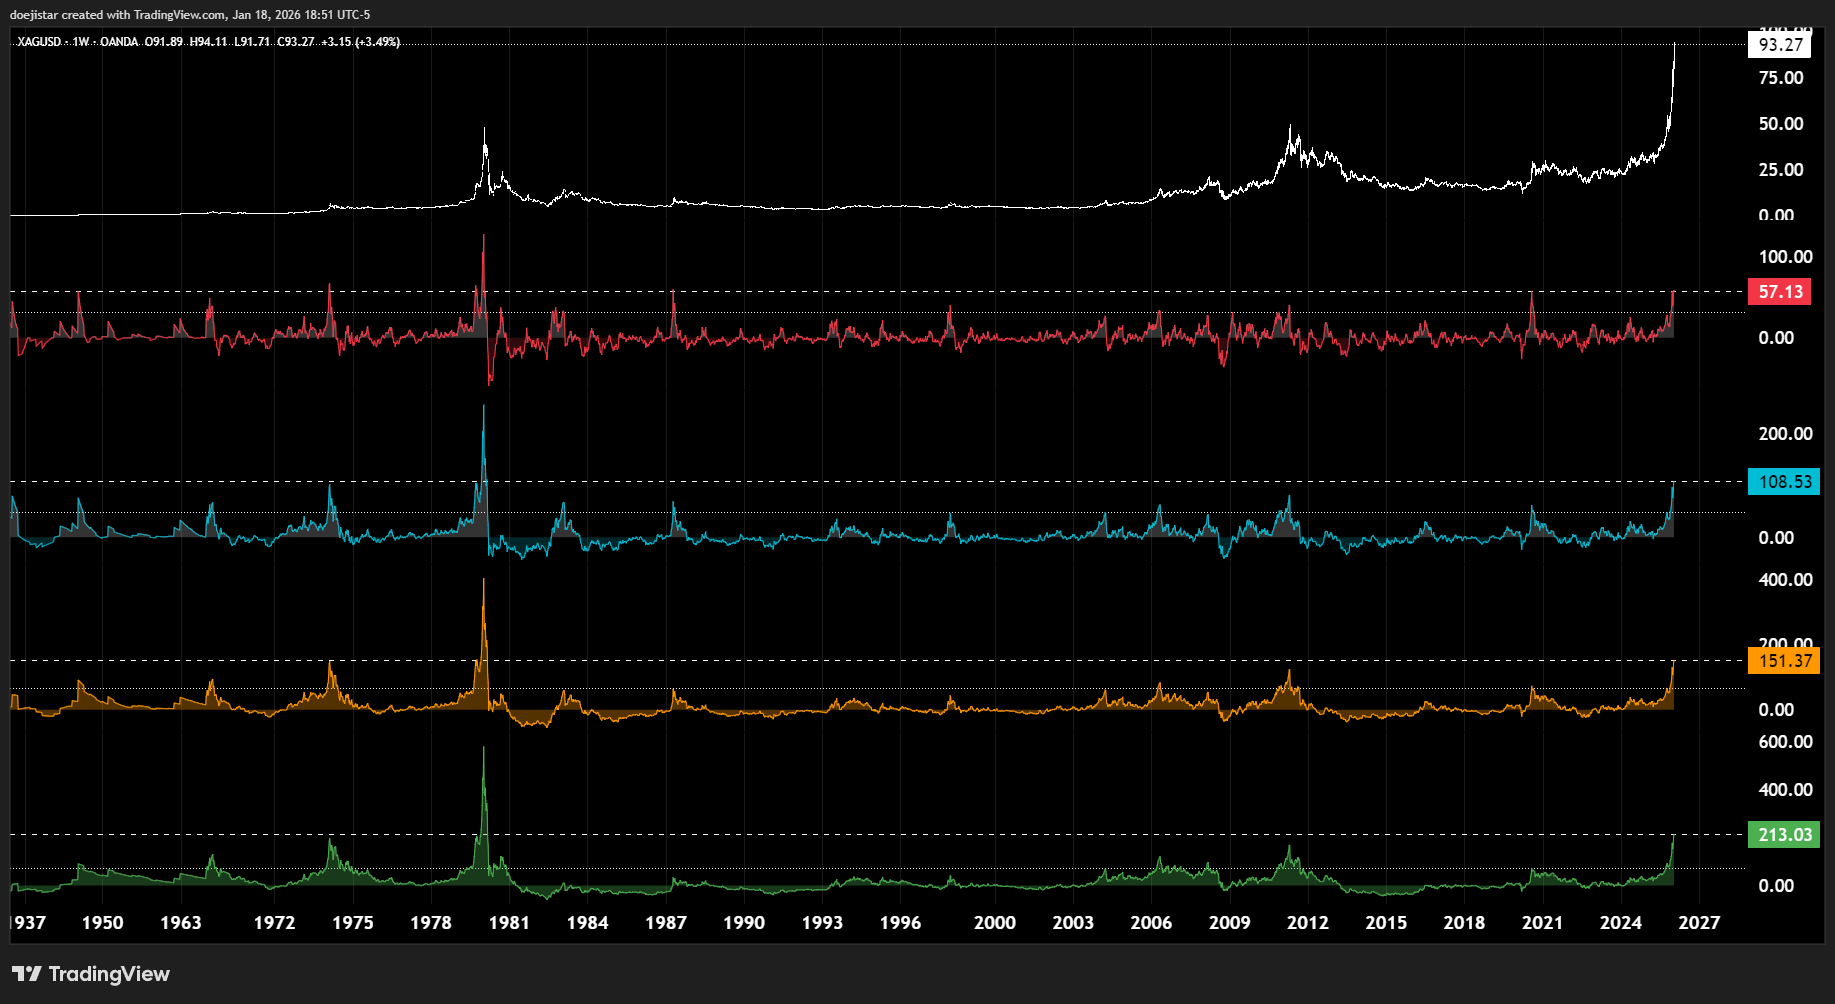
I appreciate that I could be considered crazy to even think about shorting this thing, but if we start to see a risk-off event in a way that impacts precious metals, that would certainly pique my interest. But the fact that it has shrugged off futures exchanges raising margin requirements and China attempting to ban HFT servers is off-putting enough.
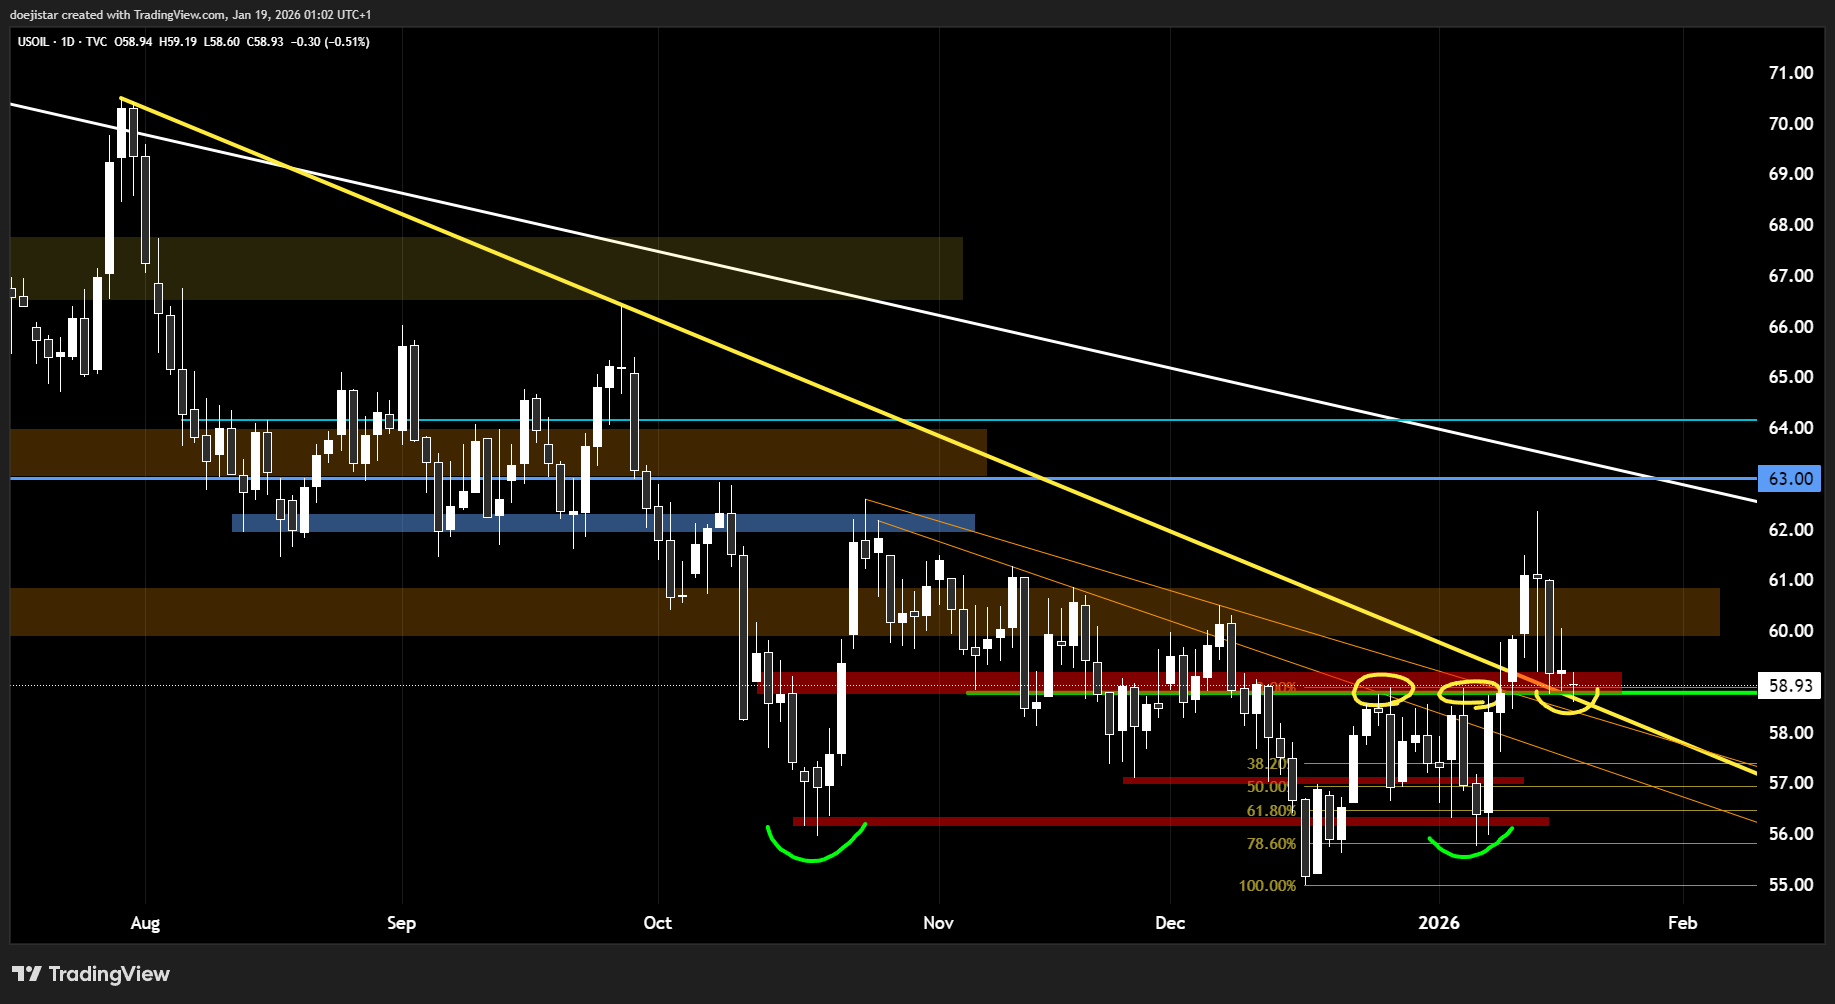
On the other hand, a much easier trade in commodities would be long Crude. Technically sound - strong impulsive breakout above the 59 handle and trendline with last week's retests holding up so far with contracting indecision bars. Outside the chart, geopolitical tensions are high and I would expect geopol premiums to provide support.
RATES & FX
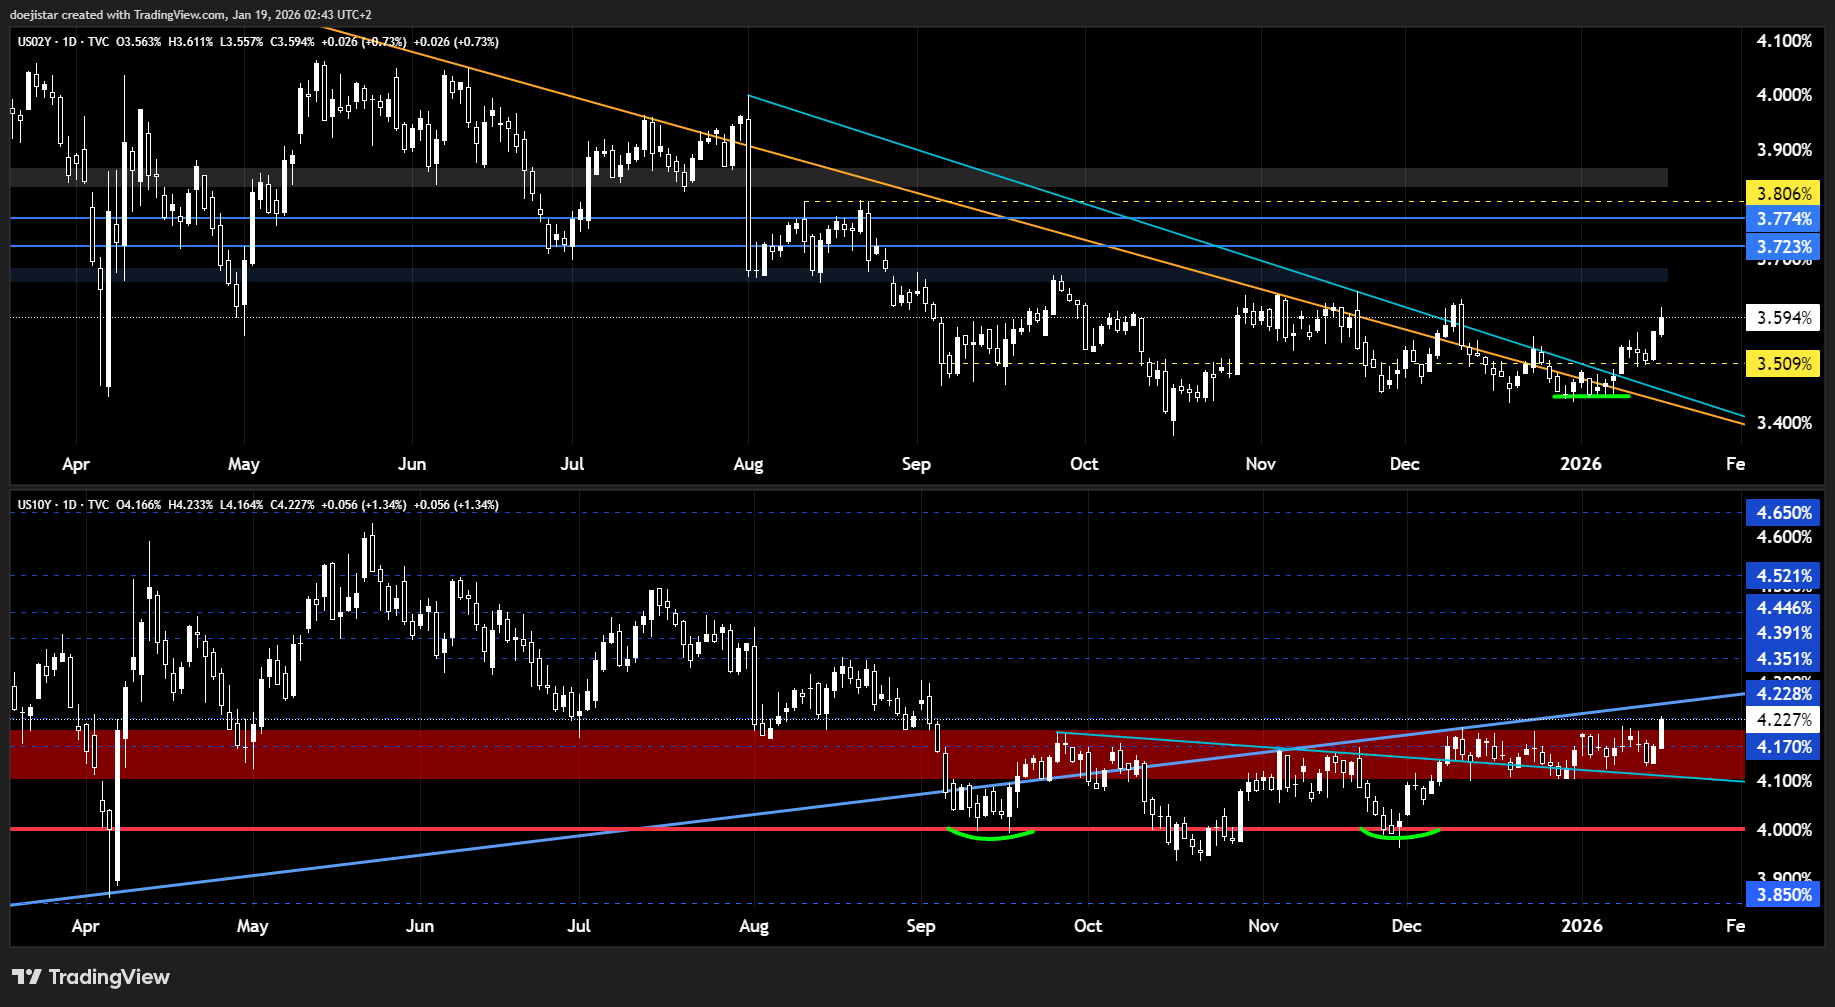
US 2 and 10 year yield are making breaks higher and measured moves would target the 3.6% area for the 2 year and 4.4% levels for the 10 year, and possibly higher. I've been discussing this possibility for some time in our group chats and streams, and it doesn't look like it will take much to get those moves going. A sustained move higher is likely to be determined by the next set of labour market data which we won't get for another couple of weeks. My sense is that the directional risk is much more balanced at these levels and the risk being skewed towards a consolidation lower.
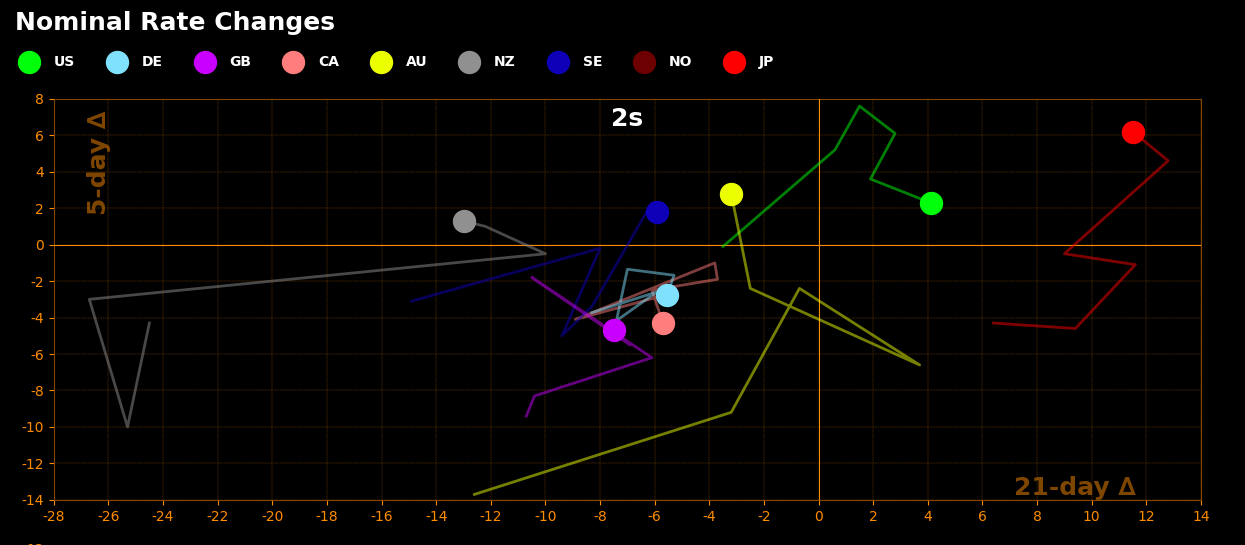
Looking at recent changes 2 year yields, USD and JPY seeing the most positive changes while GBP CAD and EUR the most negative. Those are very much in line with some of my thematic views and do see them continuing to play out.
- USD bullish on strong fundamentals with numerous signs of reaccelerating activity and labour demand recovering while wage growth is still quite firm; we may soon be at a situation where the market begins to price out odds of a 2nd cut for this year completely.
- JPY short-term bullish on risk-aversion risks and possible risk-off bid in bonds, but still favour JPY shorts for the medium to longer term.
- GBP bearish on fundamentals expected to get weaker and the middle-to-higher income classes already feeling heavily burdened by the fiscal policy outlook.
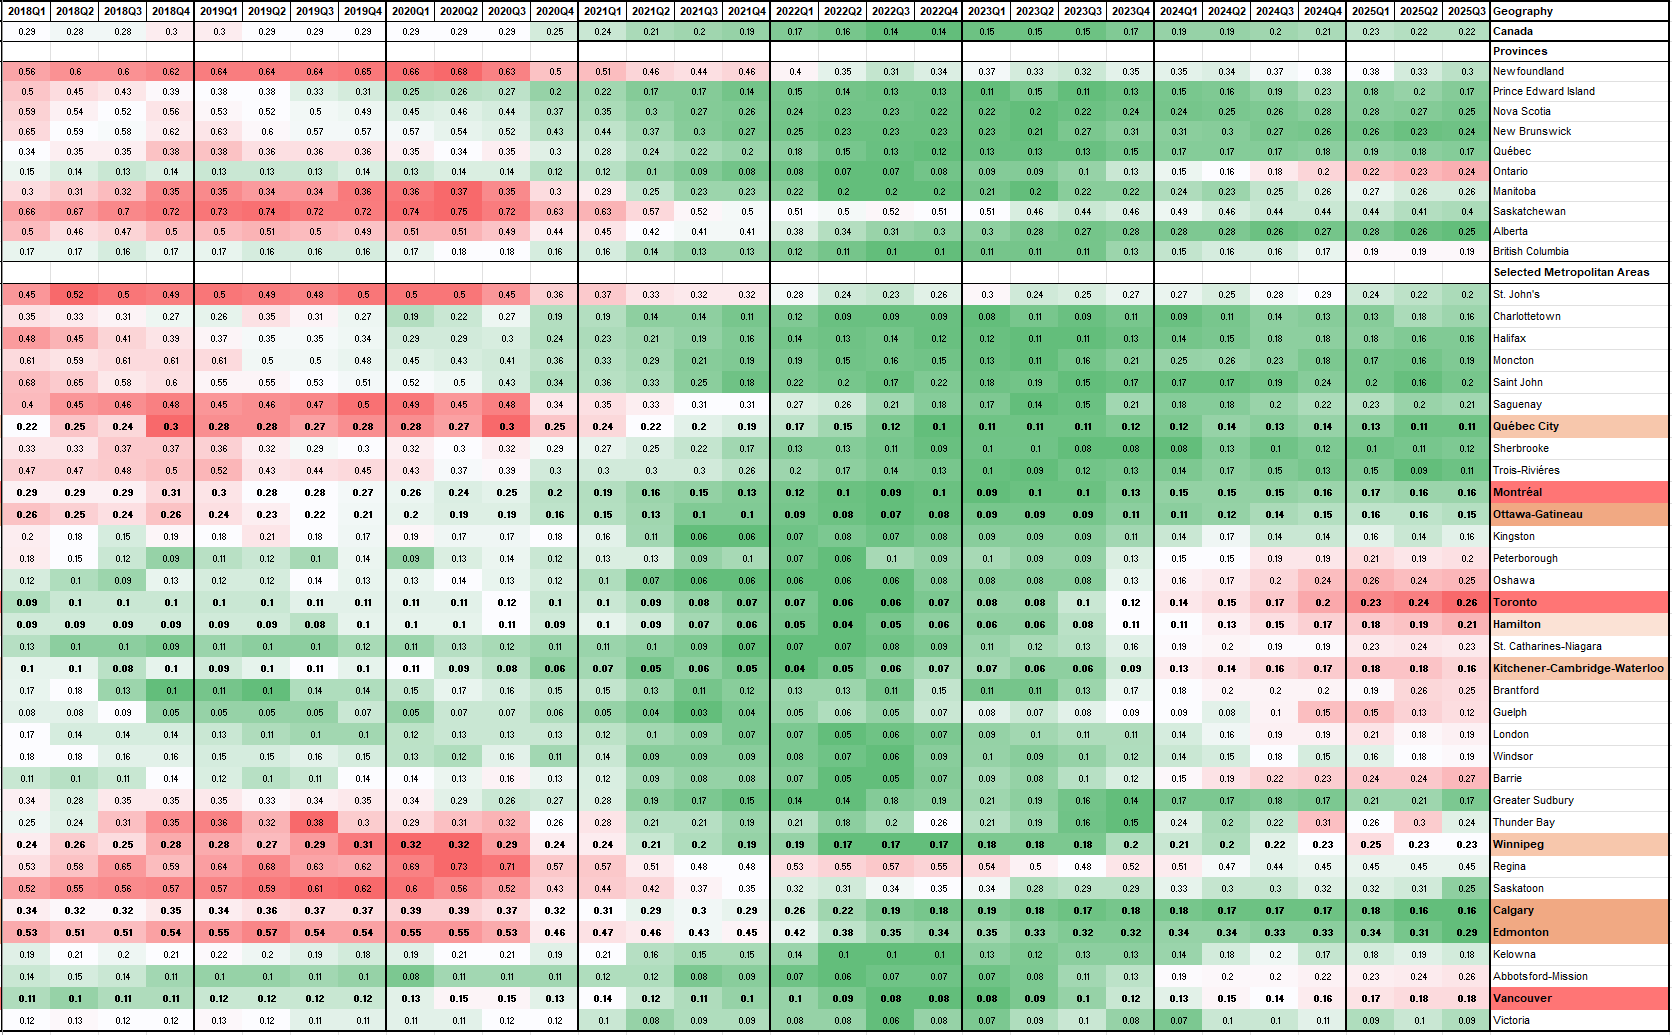
- CAD bearish - not much has changed and not much is looking better, and that's starting to be reflected in mortgage delinquencies beginning to tick up in some of the major cities (heatmap below).
- EUR bearish - inflation has been on a continuous decline for much of the last 6 months among the major powerhouse economies; increasingly likely to become a preferred fx funder in the face of stronger USD fundamentals and potential JPY strength.
CRYPTO
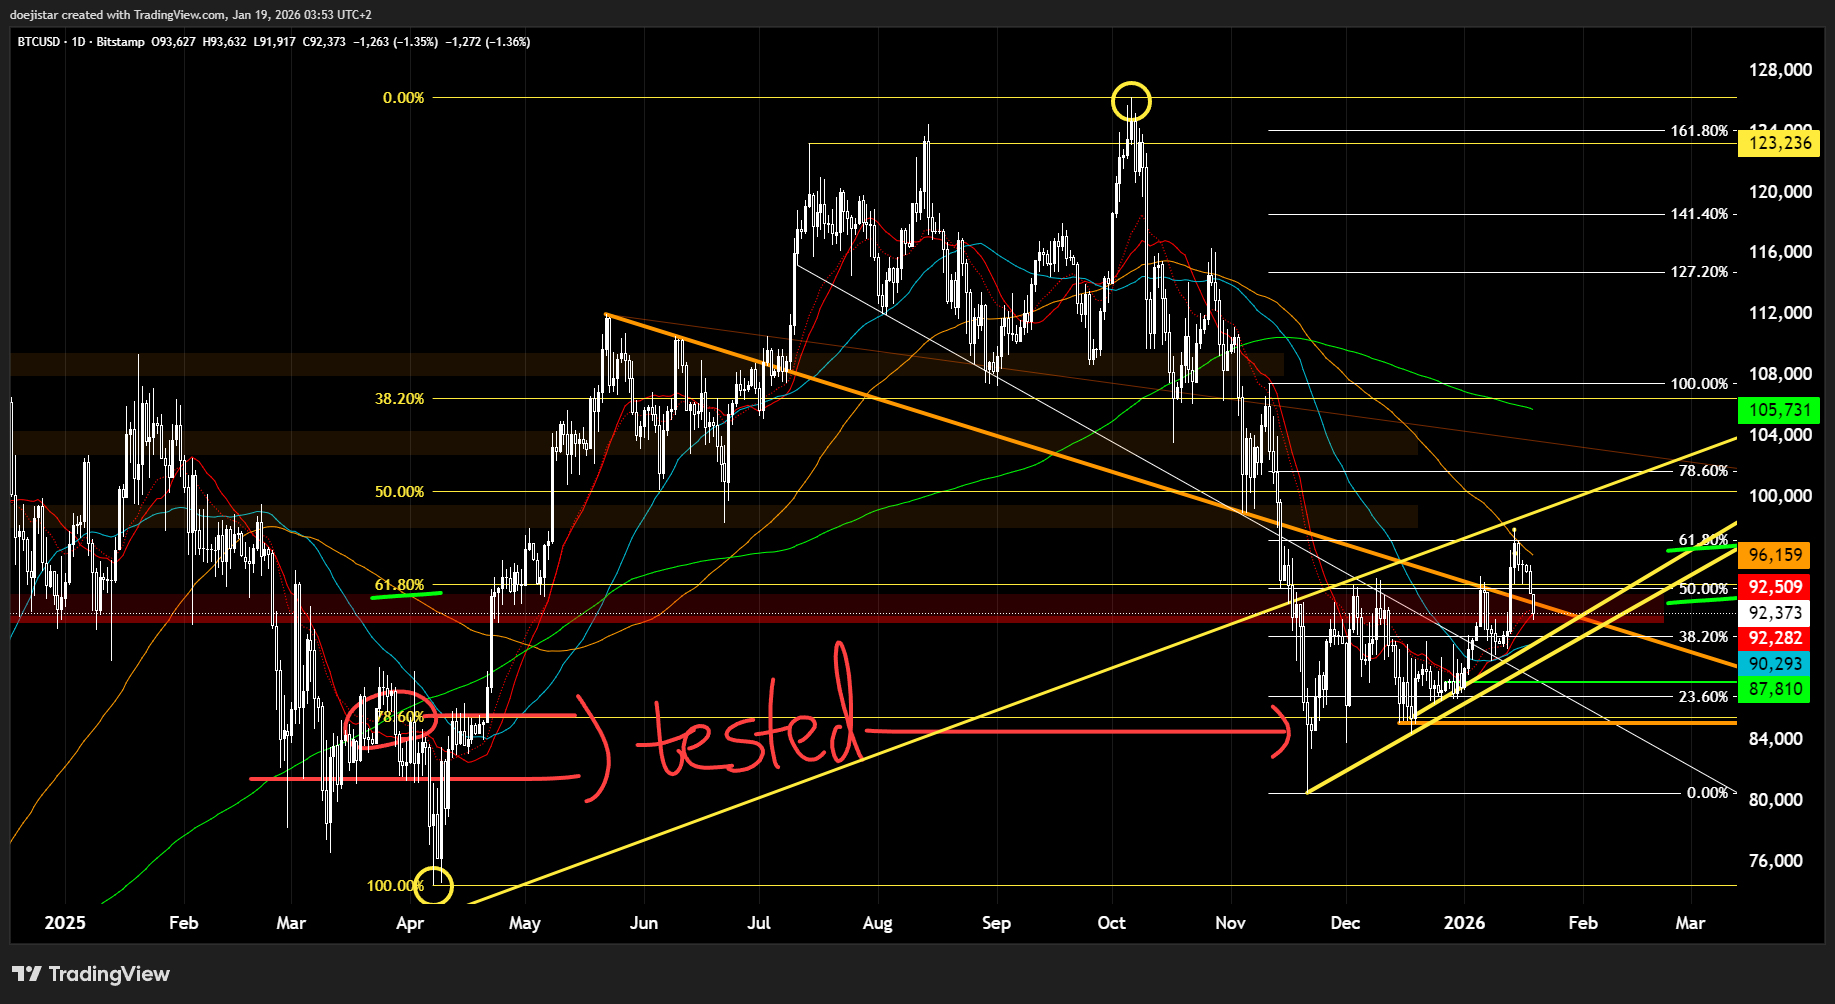
Consistent with my tactically bearish leaning on risk assets in general, I think we could see a little shake out in positioning from the accumulation of longs in recent months.
BTC rally has found resistance at the 61.8 fib retracement of the November sell leg and 100dma, and now trades below a well observed trendline (orange). There is solid support at the 92k level, but I don't think this level will hold up based on the ascending A-B-C wave bearish consolidation structure amid a higher level of geopolitical uncertainty to dampen risk appetite. On the top side, 94k has been important resistance of which the recent breakout has failed to sustain as support.
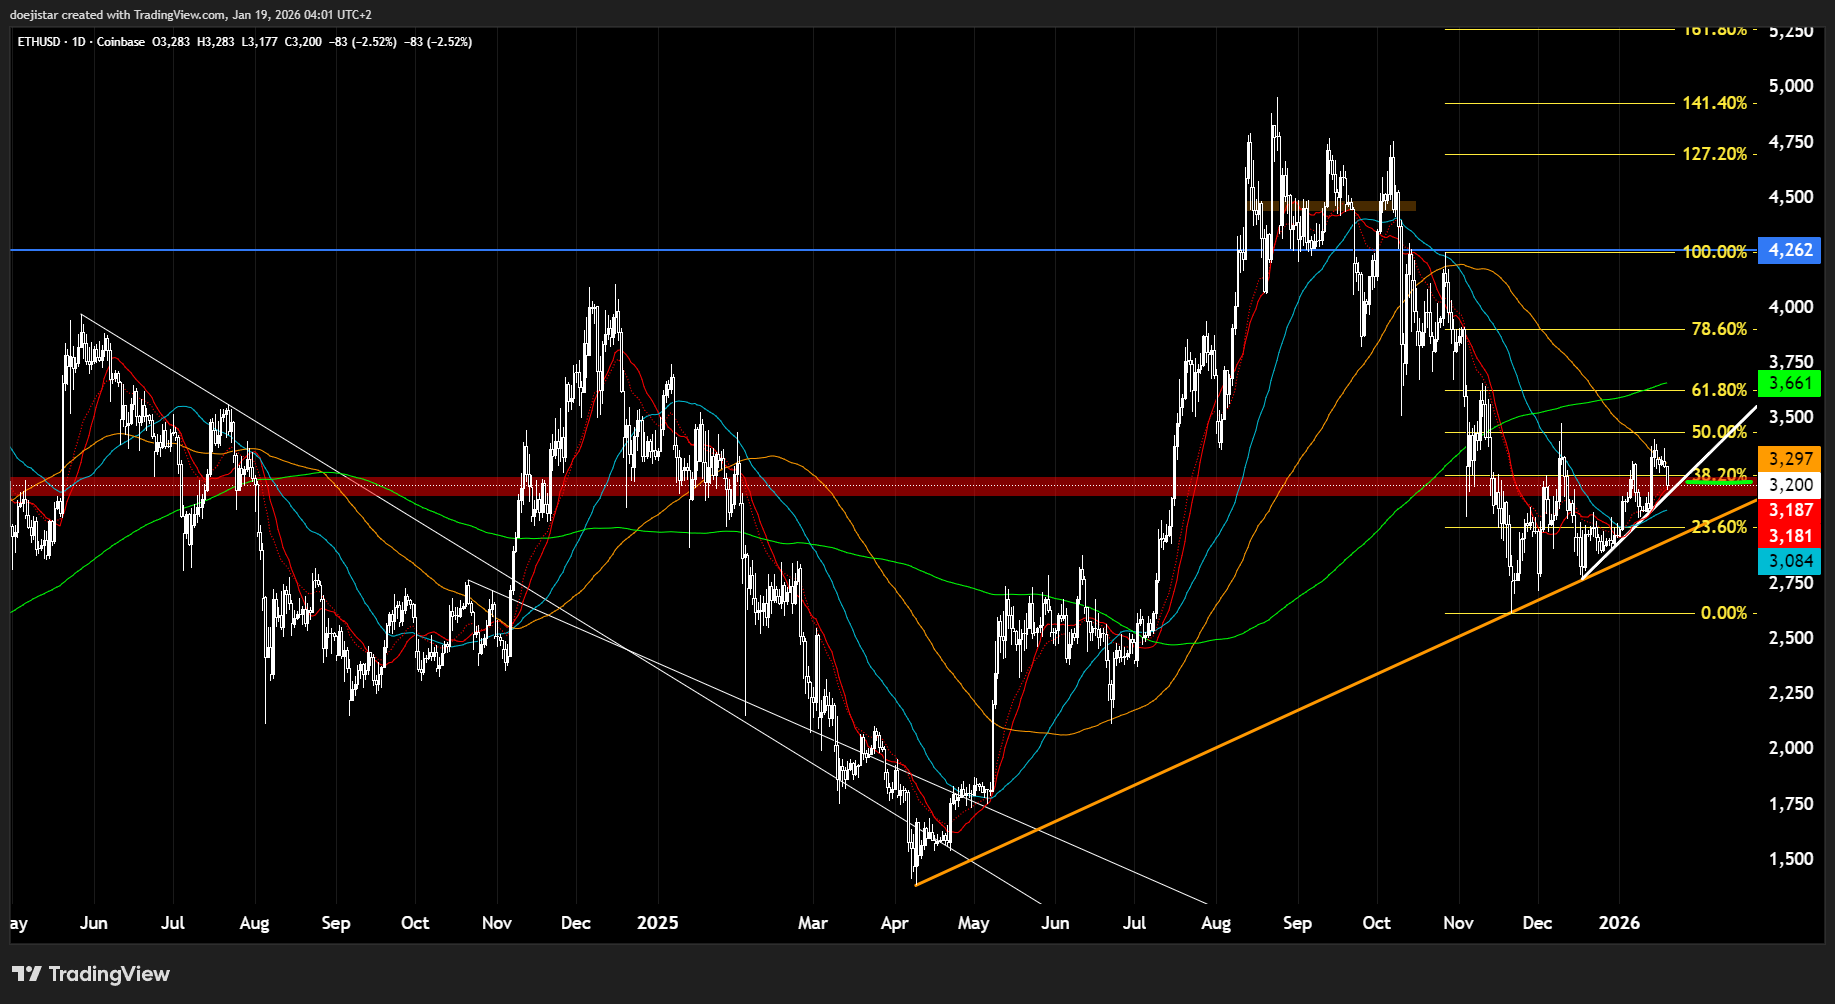
ETH similarly is attempting to hold the 3200 region which has big critical pivot level over the last 2 years. A sustained break above 3250 (~38.2 fib) would look constructive again while a break below 3150 (bottom end of the red band) would signal more losses.
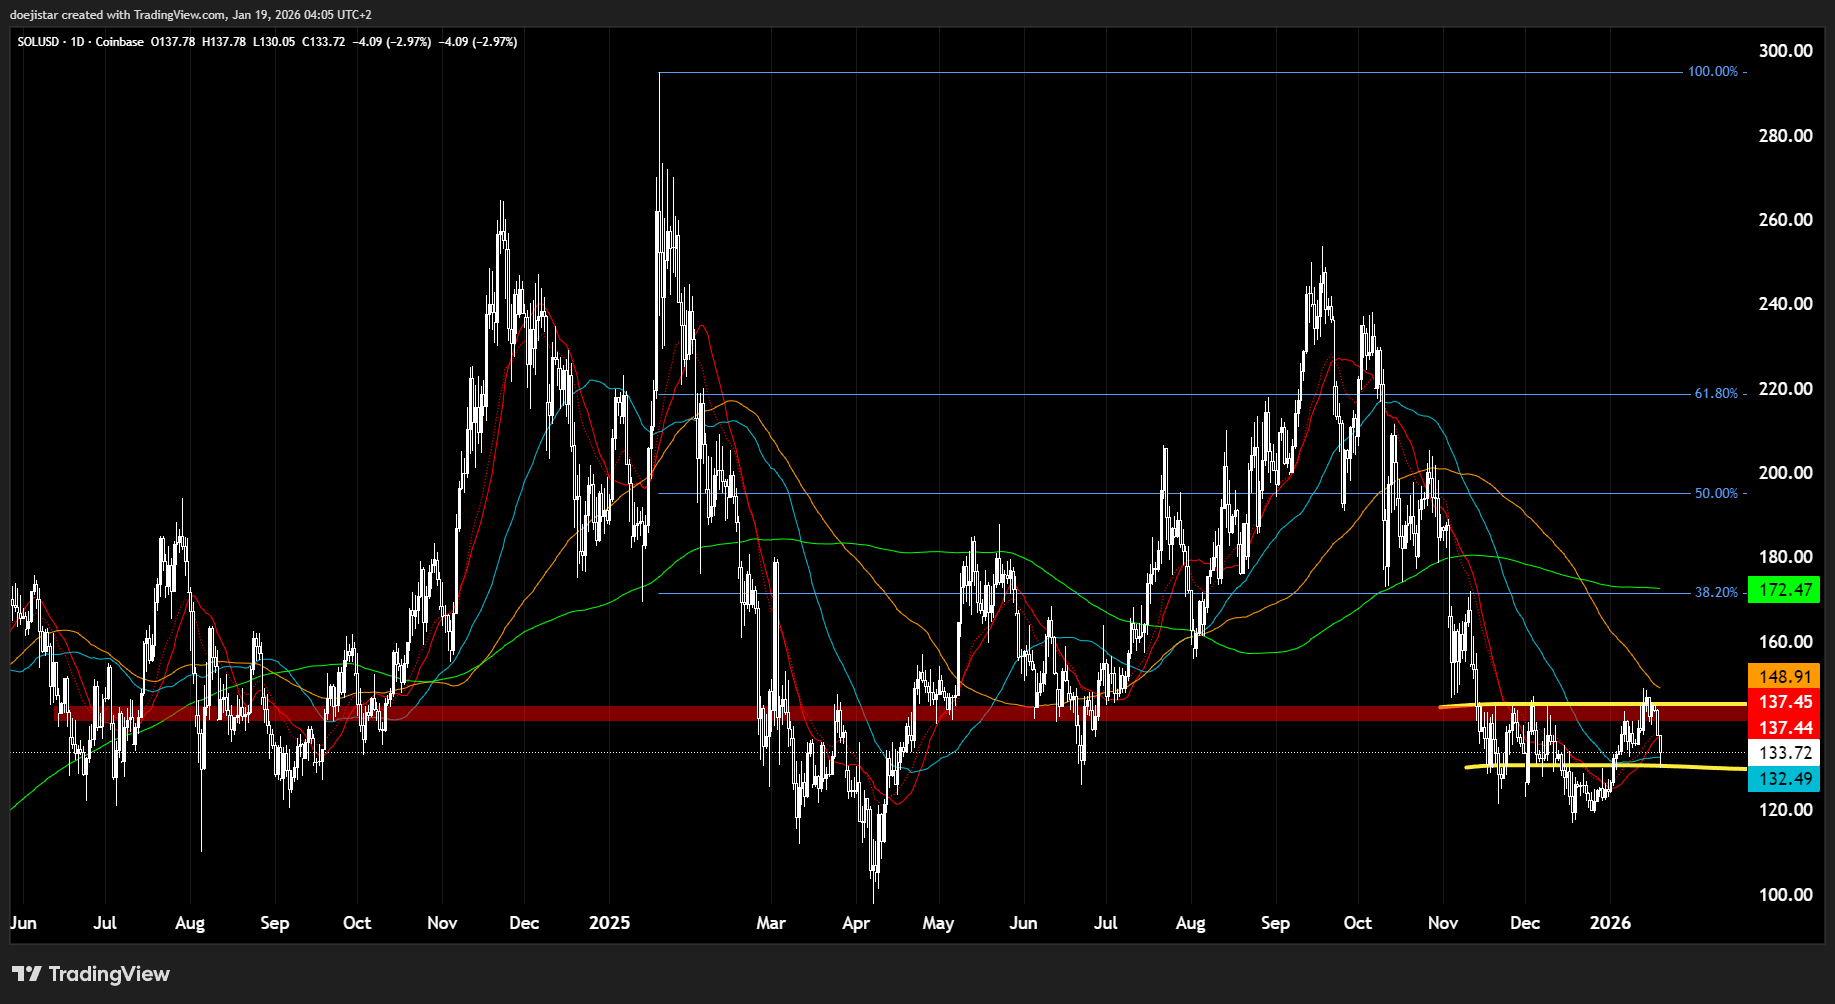
SOL is also back to a critical area of a support and looks the most appealing of the 3 for dip-buying ideas on a purely technical view. But given the potential macro impact on risk assets as a whole, I'd say it's difficult to be constructive with any conviction until it is back to pressuring the red pivot area and neckline at 145 for a break higher.
If you've enjoyed reading this, you'd probably enjoy the content and discussion in our discord group chats and daily streams. DM me on X if you'd like a short trial until the end of the month.
That's for reading and good luck trading!